|
Figure Captions
 Figure
1. The Rulison Gas Field, located in Colorado's Piceance Basin. Figure
1. The Rulison Gas Field, located in Colorado's Piceance Basin.
 Figure
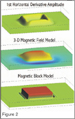
2. 3-D magnetic block model with computed field and shaded image of
first horizontal derivative amplitude. The peaks of the horizontal
derivative amplitude overlie the linear block boundaries ( Figure
2. 3-D magnetic block model with computed field and shaded image of
first horizontal derivative amplitude. The peaks of the horizontal
derivative amplitude overlie the linear block boundaries ( faults faults ). ).
Gas
production in the Rulison Field, near the town of Rifle (Figure
1), has been studied extensively by GRI (1997). In the study,
Landsat imagery, drilling information, a 3-D seismic survey, and a
high-resolution aeromagnetic (HRAM) survey complete a picture of a
basin-centered, tight gas sand reservoir. Gas production in the field is
from a tight sand in the Williams Fork Formation of the Upper Cretaceous
Mesaverde Group. Individual wells vary from non-commercial to over 3 Bcf
estimated ultimate recovery within a distance of a half mile or less.
The more
economic wells are on a structural flexure defined by well tops and 3-D
seismic data. However, bounding faults to the west, east, and south as
defined by seismic and magnetic data produce an important seal to the
reservoir. Three-D seismic is relatively effective at locating velocity
minima and anisotropic velocity anomalies that correspond to the best
wells, but its use is restricted in the Piceance due to limited surface
access and cost considerations. Aeromagnetic surveying is unencumbered
by surface restrictions, is very fast to acquire, and is inexpensive
compared to seismic, leasing and drilling.
Current
aeromagnetic technology is a much-improved tool as compared to the
ground and airborne magnetic surveys of 10 or more years ago. The GPS
satellite navigation allows flight lines to be positioned and located
within a few meters of desired location, providing for improved flight
line leveling and interpolating onto map grids. HRAM surveys are
optimally flown with closer spaced lines -- in this case, a 250m by
1,000m array of lines.
Recently
developed processing techniques remove noise due to surface sources such
as wells, pipelines, and towns, thus providing a much cleaner signal.
Computer filtering, imaging and interpreting tools are important
upgrades to the old familiar contouring and hand interpreting
techniques.
Intrasedimentary magnetic fault anomalies in the Piceance are
pre-amplified on the profiles and interpolated from the 250m-spaced
decultured profile data onto a 100m grid. The total magnetic intensity
grid is then filtered by a sequence of steps including a
reduction-to-pole filter, Wiener pseudo depth matched filter (focusing
on the 5,000 to 6,000 foot depth range), and horizontal derivative
filter.
Figure 2 illustrates the nature of magnetic lineaments mapped by the
first horizontal derivative conversion. The figure displays a synthetic
block model, its magnetic field model and a shaded relief image of the
first horizontal derivative amplitude. The magnetic anomaly has its
steepest gradient (dip) over the bounding faults of the body. Nearly
linear intrasedimentary faults or lateral termination of slightly
magnetic sands produce correspondingly linear observed magnetic
gradients that can be imaged in the same manner.
Figure 3 is a northeast sun shaded relief image of the horizontal
derivative grid over the Rulison Gas Field. Townships are overlaid in
blue for location and scale. Actual subsurface fault/lineament locations
are at linear trends, where lighter slopes facing the northeast sun turn
to dark away from the sun toward the southwest. The line of change from
light to dark is highlighted in pink, and is the fault/lineament
location.
Figure 4 demonstrates a northwest sun angle for the same area,
highlighting anomaly trends that are much weaker in a northeast
orientation. Real time sun angle rotation on the computer screen is very
helpful for detecting lineaments of a preferred orientation.
A new
method of lineament detection uses the full horizontal gradient,
including both amplitude and azimuth.
Figure 5 shows a color SUNMAG image
showing all dip directions as a unique color, with the color key
superimposed in the top left corner of the figure. SUNMAG imaging
delineates lineaments of all orientations simultaneously -- and, in
fact, picks up more subtle faults than the gray single-direction sun
shadowgraphs, because the horizontal gradient direction is a more
sensitive indicator of fault anomalies than the gradient amplitude
alone.
The
computer automatically detects faults with an AUTOFAULT algorithm based
upon a neural network technique for detecting discontinuities in the
horizontal gradient azimuth and amplitude data. The AUTOFAULT computer
fault picks are superimposed as black lines on the
Figure 5 SUNMAG image to highlight dip compartments between faults.
Integrating the magnetic fault picks (yellow) and 3-D seismic fault
picks (red) with color contoured, estimated ultimate recovery from wells
produces a good picture of why the better wells line up in a
north-northwest direction (Figure
6, GRI, 1997). The warmer colors correspond to wells with more than
3.5 Bcf per well estimated ultimate recovery. The best wells in sections
17 and 20 lie between northwest-trending sealing faults.
Within the
3-D seismic survey area, faults identified at the Mesaverde level
correlate locally with interpreted regional magnetic faults. The
magnetically defined delineate pressure compartment boundaries within
the field and extend beyond the 3-D seismic survey. A comprehensive
integration of well results, 3-D seismic, and aeromagnetic imaging
provides a model for locating lead areas in the greater Piceance Basin
similar to the Rulison Field. Although the aeromagnetic imaging has much
coarser spatial resolution than 3-D seismic data, it is relatively
inexpensive to use over a broad area of reconnaissance exploration prior
to exploratory drilling and detailed 3-D seismic surveying.
Recognizing regional fault patterns in prospective basin-centered gas
plays is a critical element based on known analog fields. Seismically
interpreted faults and magnetically imaged faults in Wyoming's Green
River Basin have confirmed that sealing faults bound the recently
developed, 1 TCF Jonah gas field.
The
similarity to the observed pattern of bounding faults around the better
producing wells in the Rulison gas field point to a picture of
compartmentalization of tight gas reservoirs. An exploration strategy
based upon this model can be applied to other gas and oil plays in the
Rocky Mountains and Canada as well as to many basins around the world. around the better
producing wells in the Rulison gas field point to a picture of
compartmentalization of tight gas reservoirs. An exploration strategy
based upon this model can be applied to other gas and oil plays in the
Rocky Mountains and Canada as well as to many basins around the world.
Return
to top.
|
 Figure
3.Shaded-relief image of horizontal derivative amplitude of the
5,000-6,000-foot depth-sliced, reduced-to-pole magnetic intensity
Figure
3.Shaded-relief image of horizontal derivative amplitude of the
5,000-6,000-foot depth-sliced, reduced-to-pole magnetic intensity Figure
4. Another view of the same shaded-relief image of the same horizontal
derivative amplitude, this time with the sun in the northwest
illuminating weak northeast trends
Figure
4. Another view of the same shaded-relief image of the same horizontal
derivative amplitude, this time with the sun in the northwest
illuminating weak northeast trends Figure
5. SUNMAG image with block AUTOFAULT
Figure
5. SUNMAG image with block AUTOFAULT  Figure
6. A contoured estimated ultimate recovery from wells in the Rulison Gas
Field (GRI, 1997)
Figure
6. A contoured estimated ultimate recovery from wells in the Rulison Gas
Field (GRI, 1997)