Print this page
Click on line to view seismic line (Figure 4).
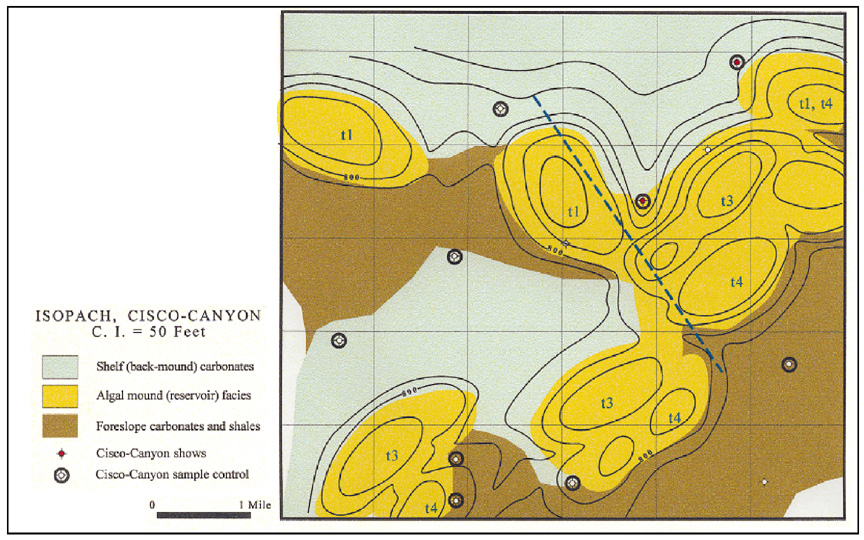
Figure 3. Geologic map showing algal mound and related facies defined by sample evaluation and 2-D seismic data. Dashed blue line is approximate trend of the seismic line shown in Figure 4.