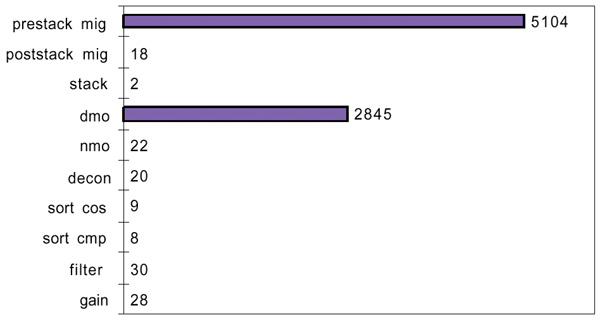
Figure 11. This chart illustrates processing time in seconds for a small sample data set. The relative times are important, not the size of the data set or kind of machine used. Starting from the bottom, the processes represent (in order) a more-or-less standard processing flow. By far the most expensive item here is DMO. However, if we run pre-stack migration instead, it is even more expensive. Basically, the pre-stack migration replaces NMO, DMO, stack and post-stack migration. Due to the cost, pre-stack migration is a method to be used only when required by strong lateral velocity variations and/or extreme structure.