|
Summary
Statement
The
seismic  wavelet wavelet is the link between seismic data (traces) on which
interpretations are based and the geology (reflection coefficients) that
is being interpreted, and it must be known to interpret the geology
correctly. However, it is typically unknown, and assumed to be both broad
band and zero phase. Providing this broad band, zero phase wavelet is the
processing goal of deconvolution. Unfortunately, this goal is rarely met
and the typical wavelet that remains in fully processed seismic data is
mixed-phase. Differences in mixed-phase wavelets result in mis-ties and
often incorrect interpretations. is the link between seismic data (traces) on which
interpretations are based and the geology (reflection coefficients) that
is being interpreted, and it must be known to interpret the geology
correctly. However, it is typically unknown, and assumed to be both broad
band and zero phase. Providing this broad band, zero phase wavelet is the
processing goal of deconvolution. Unfortunately, this goal is rarely met
and the typical wavelet that remains in fully processed seismic data is
mixed-phase. Differences in mixed-phase wavelets result in mis-ties and
often incorrect interpretations.
The
purpose of this article is to show interpreters that significant
improvements in seismic data quality and, correspondingly, their
interpretations of those data are easily obtainable by converting from
mixed-phase to zero phase wavelets.
Figure
Captions
 Figure
1: Lithologic boundaries define a Reflection Coefficient series, which
when convolved (*) with the field wavelet results in a simulated raw field
trace. Interpreting the highest amplitude event (2.5 seconds) as the
reservoir sand would be wrong. This mixed-phase wavelet provides a
distorted image of the actual geology. Figure
1: Lithologic boundaries define a Reflection Coefficient series, which
when convolved (*) with the field wavelet results in a simulated raw field
trace. Interpreting the highest amplitude event (2.5 seconds) as the
reservoir sand would be wrong. This mixed-phase wavelet provides a
distorted image of the actual geology.
 Figure
2: When the field wavelet is known, deterministic deconvolution is able to
produce a processed trace that contains the desired broad band zero
phase wavelet. Note, the highest amplitude in the processed trace is now
associated with the largest Reflection Coefficient at the top sand. Figure
2: When the field wavelet is known, deterministic deconvolution is able to
produce a processed trace that contains the desired broad band zero
phase wavelet. Note, the highest amplitude in the processed trace is now
associated with the largest Reflection Coefficient at the top sand.
 Figure
3: Extracted wavelet and the associated amplitude and phase spectrum. Figure
3: Extracted wavelet and the associated amplitude and phase spectrum.
 Figure 4: Seismic data containing this mixed-phase wavelet will display a
changing peak trough relationship (-90 degrees to +60 degrees) and time
shift (linear phase) due to the earth’s attenuation of higher
frequencies with depth. For simplicity, the waveforms shown here are only
for the top sand reflector.
Figure 4: Seismic data containing this mixed-phase wavelet will display a
changing peak trough relationship (-90 degrees to +60 degrees) and time
shift (linear phase) due to the earth’s attenuation of higher
frequencies with depth. For simplicity, the waveforms shown here are only
for the top sand reflector.
 Figure
5. These wavelets have been extracted from the seismic in Figures 7 and 8 using the well reflection Coefficients Statistical Deconvolution (a)
commonly produces mixed-phase wavelets. The broad band - zero phase
processing goal of deconvolution has been met using Deterministic
Deconvolution (b). Figure
5. These wavelets have been extracted from the seismic in Figures 7 and 8 using the well reflection Coefficients Statistical Deconvolution (a)
commonly produces mixed-phase wavelets. The broad band - zero phase
processing goal of deconvolution has been met using Deterministic
Deconvolution (b).
 Figure
6. The mixed-phase wavelet (Figure 5a) has the character of “Pinocchio
with a beer-gut.” Each reflector has a sharp nose followed by a low-frequency
“beer-gut.” The zero
phase wavelet (Figure 5b) has all the energy moved up to Pinocchio’s
nose. Reflectors lacking the wavelet’s beer-gut more clearly image the
subsurface geology. Figure
6. The mixed-phase wavelet (Figure 5a) has the character of “Pinocchio
with a beer-gut.” Each reflector has a sharp nose followed by a low-frequency
“beer-gut.” The zero
phase wavelet (Figure 5b) has all the energy moved up to Pinocchio’s
nose. Reflectors lacking the wavelet’s beer-gut more clearly image the
subsurface geology.
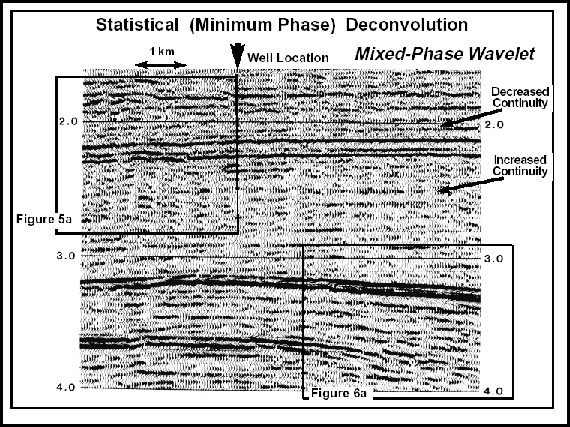
 Figure
7. Seismic data identical to Figure 8 other than the method of
deconvolution, Statistical. This seismic data contains the mixed-phase
wavelet of Figure 5a. The “Pinocchio with a “beer-gut” character can
be seen as the trailing low frequencies beneath the high amplitude
reflectors. Mixed-phase wavelets reduces the ability to accurately resolve
the subsurface geology. Figure
7. Seismic data identical to Figure 8 other than the method of
deconvolution, Statistical. This seismic data contains the mixed-phase
wavelet of Figure 5a. The “Pinocchio with a “beer-gut” character can
be seen as the trailing low frequencies beneath the high amplitude
reflectors. Mixed-phase wavelets reduces the ability to accurately resolve
the subsurface geology.
Click
here for sequence of Figures 7 and 8.
 Figure
8. Seismic data identical to Figure 7 other than method of deconvolution,
Deterministic. This seismic data contains the desired zero phase wavelet (Figure 5b). Note that reflectors are sharper and lack the low-frequency
“beer-gut” of the mixed- phase wavelet. In general reflector
continuity, fault breaks, and stratigraphic relationships are
significantly improved. Figure
8. Seismic data identical to Figure 7 other than method of deconvolution,
Deterministic. This seismic data contains the desired zero phase wavelet (Figure 5b). Note that reflectors are sharper and lack the low-frequency
“beer-gut” of the mixed- phase wavelet. In general reflector
continuity, fault breaks, and stratigraphic relationships are
significantly improved.
Click
here for sequence of Figures 7 and 8.
 Figure
9. Enlargement of corresponding parts in upper left of Figures 7 and 8,
showing significantly different seismic images from the same subsurface
geology. The zero phase (b) seismic data not only “looks” better, but
also provides a more accurate image. Mixed-phase wavelets distort the
seismic image and can lead to incorrect interpretations. Figure
9. Enlargement of corresponding parts in upper left of Figures 7 and 8,
showing significantly different seismic images from the same subsurface
geology. The zero phase (b) seismic data not only “looks” better, but
also provides a more accurate image. Mixed-phase wavelets distort the
seismic image and can lead to incorrect interpretations.
 Figure
10. Enlargement from corresponding parts in lower right of Figures 7 and 8
showing significant improvements in the definition of faults are seen on
the zero phase seismic data (b). “Pinocchio’s beer-gut” in the
mixed-phase seismic data (a) hangs over the faults, distorting the image.
Reflector continuity and stratigraphic relationships are also improved in
the seismic data containing the zero phase wavelet. Figure
10. Enlargement from corresponding parts in lower right of Figures 7 and 8
showing significant improvements in the definition of faults are seen on
the zero phase seismic data (b). “Pinocchio’s beer-gut” in the
mixed-phase seismic data (a) hangs over the faults, distorting the image.
Reflector continuity and stratigraphic relationships are also improved in
the seismic data containing the zero phase wavelet.
Return
to top.
Goals
of Deconvolution
Seismic
data can provide a remarkably good image of the subsurface. However,
without knowing the seismic wavelet, there are many equally valid surface
geologic interpretations of the actual subsurface geology. The seismic
wavelet is the filter through which geology is viewed when interpreting
the image provided by seismic data.
The
common assumption that seismic data contain a broad band - zero phase
wavelet is nearly always wrong. The majority of mis-tie problems between
seismic and synthetics, seismic to seismic of different vintages, and many
of the misinterpretations based on modeling (lithology prediction, trace
attributes, AVO, etc.) are the result of mixed-phase wavelets remaining in
fully processed seismic data.
The
convolutional model is useful for understanding how changes in rock
properties (velocity and density) result in the waveform changes observed
in seismic data. At lithologic boundaries the magnitude of change
(reflection coefficient) in these rock properties determines how much of
the wavelet’s energy is reflected to the surface. In acquiring seismic
data (Figure 1), the subsurface is illuminated with sonic energy (field
wavelet), which is reflected from these acoustic boundaries and recorded
at the surface as a raw field trace.
Where
lithologic boundaries are widely separated, the field wavelet can be seen
“hanging” below the reflector at 2.2 seconds (Figure
1). When
boundaries are more closely spaced (2.3-2.5 seconds), the wavelet is not
as easily seen due to the wavelets being summed together. This summing is
also known as convolution.
The
convolutional model states that all seismic traces are the result of
convolving (summing) the wavelet with the reflection coefficient series.
In Figure 1, the raw field trace images the desired geology (lithologic
boundaries = reflection coefficients), but it is through the complex
filter (convolution) of the field wavelet.
Exploring
for the sand in Figure 1 and assuming the wavelet is broad band - zero
phase, the sand should be the largest peak. The largest peak, however, is
at 2.5 seconds, due to the field wavelet not being zero phase. When the
wavelet in the seismic trace is unknown, the geology is unknown.
Interpretations are not made on raw field traces, but even on processed
seismic traces, the wavelet must be known to more correctly interpret the
geology.
The
seismic processing procedure designed to convert the field wavelet to the
desired broad band - zero phase wavelet is deconvolution. The two common
methods of deconvolution are deterministic deconvolution and statistical
deconvolution.
Deterministic
deconvolution can be applied when the field wavelet is known (measured
and/or modeled). As shown in Figure 2, when the wavelet is known, an
inverse can be determined and the field trace deconvolved to contain the
desired zero phase wavelet. When processed traces contain a zero phase
wavelet, increases in rock velocity (shale to sand) will result in peaks
(positive reflection coefficients).
More
typically, the field wavelet is unknown and statistical deconvolutions
must be used. Statistical deconvolutions must make assumptions about both
the wavelet and the reflection coefficient series. The most common
assumption is that the wavelet is minimum phase and that the reflection
coefficient series is random.
Return
to top.
Over
90 percent of all seismic data are processed assuming minimum phase.
Examples of a few of the more popular minimum phase deconvolutions include
Spiking, Gapped, Predictive, and Adaptive. Unfortunately, most field
wavelets are not minimum phase, and that basic assumption is not met.
Using minimum phase deconvolutions typically results in processed traces
that contain mixed-phase rather than the desired zero phase wavelets.
A
wavelet extracted deterministically from seismic data (using the known
reflection coefficient series from the well) that had been deconvolved
assuming minimum phase is shown in Figure 3. Note that this wavelet is not
zero phase (phase spectrum: constant zero value for all frequencies) but
is mixed phase (non-linear, variable for all frequencies).
In
describing mixed-phase wavelets, it is useful to group frequency into
bands in which a linear fit can be extrapolated to the phase axis (phase
spectrum). For the wavelet in Figure 3, the higher frequencies (20-65
Hertz) have a phase of -90 degrees, while the lower frequencies (5-20
Hertz) have a phase of +60 degrees.
The
description of this mixed-phase wavelet is interpretive, and could be
described differently by using other frequency bands. Using the bands
shown in Figure 3, with most of the power (amplitude spectrum squared) in
the 20-65 Hertz band, this wavelet has the phase characteristic of -90
degrees (trough-peak).
An
important ramification of mixed-phase wavelets is that their peak-trough
relationships will change with depth due to the effects of earth
filtering. In the case of the wavelet shown in Figure
3, shallow in the
section where the earth has not filtered the higher frequences (maximum
power 20-60 Hertz), positive reflectors (low to high velocity) will
display -90 degrees (trough-peak). Deep in the section where the high
frequencies have been attenuated (dashed line in the amplitude spectra, Figure
3), the wavelet will appear with the phase characteristics of the
lower frequencies and will have a phase of +60 degrees (peak-trough).
Mixed-phase
wavelets are the most common wavelets found in seismic data and can have a
strong affect on interpretations. This is shown in Figure 4 by filtering
back (5-20 Hertz) the processed wavelet to illustrate strong earth
filtering. The identical reservoir sandstone would appear as a trough-peak
(-90 degrees) shallow (1.0 seconds) in the section and as a peak-trough
(+60 degrees) deeper (3.0 seconds) in the section. This change in the
peak-trough relationship due to earth filtering is commonly observed when
comparing constant phase synthetics (from well logs) to seismic data.
Typically this problem is compensated by applying a bulk time shift
(linear phase shift) and changing the constant phase wavelet used in
making the synthetic.
Combining
these corrections will approximate the curved shape of the mixed-phase (Figure
3) with a single sloping line (time shift) that intersects the
phase axis at the desired constant phase. A different time shift and
constant phase is required to match the curve deeper in the section due to
the earth’s absorption of higher frequencies.
Due
to the mixed-phase wavelet, peak-trough relationship change as a function
of earth absorption (Figure 4), and interpretations based on amplitudes,
AVO, attributes, etc., are likely to be incorrect. The solutions to these
problems are to convert the mixed-phase wavelet to zero phase in seismic
processing or to extract the mixed-phase wavelet, know its effects, and
use it when modeling.
When
interpreting seismic data, it is important to realize that the actual
subsurface geology is always being viewed through the filter of the
seismic wavelet. Although deconvolution is designed to provide a broad
band - zero phase wavelet, this goal is typically not met, and most
seismic data contain mixed-phase wavelets. Mixed-phase wavelets affect
interpretations and, as noted below, degrade the quality of seismic data.
Return
to top.
Comparison
of Seismic Data After Different Methods of Deconvolution
The
wavelets shown in Figure 5 were extracted from the seismic data in
Figures
7 and 8. Both sets of seismic data were processed identically, other than
the method of deconvolution (statistical-minimum phase vs. deterministic).
The wavelets were extracted deterministically, by cross-correlating
(Wiener-Levinson filter) seismic traces with the known geology derived
from the subsurface well reflection coefficient series. At first glance,
most interpreters would be content having either of these “spike-like”
wavelets convolved on the subsurface reflectors. The primary difference
between these wavelets is that statistical deconvolution has resulted in a
mixed-phase wavelet (Figure 5 – phase spectrum), whereas the
deterministic deconvolution provided the desired broad band, zero phase
wavelet. These seemingly minor differences in the phase spectra (Figure
5)
have a significant effect on the seismic data’s overall quality.
Although the “quality” of seismic data has always been in the “eye
of the beholder,” the conversion from mixed-phase to zero phase provides
a more accurate image of the subsurface geology.
The
reason for the improved accuracy is illustrated in Figure
6. The extracted
wavelets (Figure 5) have been convolved on a single reflector (Top Sand).
Note that the mixed-phase wavelet has sharp “Pinocchio-like” nose at
the top of the sand, but is followed by a low-frequency “beer-gut.”
When seismic data contains a mixed-phase wavelet, each reflector has this
“Pinocchio with a beer-gut” character. Neighboring reflectors deeper
in the section (base sand) are phase rotated and lose amplitude as their
“noses” are summed with the “beer-guts” from above.
The
zero phase wavelet’s sharp “nose” provides a clear image of the top
sand, and its “flat belly” does not interfere with neighboring
reflectors. The comparison of the seismic data in Figures 7 and
8 illustrate typical improvements that are easily obtainable by converting
from mixed-phase to zero phase. Both seismic sections “look” good, and
visual advantages can be found in each. In general, however, the seismic
data containing the zero phase wavelet (Figure
8) have a better overall
reflector continuity, better fault definition and more easily identified
stratigraphic relationships. Mixed-phase wavelets may occasionally tune to
enhance a particular reflector (Figure 7 – increased continuity), but
the overall quality of mixed-phase data is lower.
The
seismic data comparison for the shallower section is shown in Figure 9.
Return
to top.
Due
to minor earth absorption, the majority of the wavelet’s phase
characteristics, as noted above, are derived from the higher frequencies
(20-65 Hertz). The lower frequencies, although contributing less, still
influence the character of the reflectors. The non-zero phase components
(5-20 Hertz) of the mixed-phase wavelet (Figure 9a) can be seen distorting
the image of the geology.
These
two images (Figure 9a and b) of the same geology would likely result in
different interpretations. For example, laterally discontinuous reflectors
within the high amplitude package (2.2-2.3 seconds) appear with different
seismic character and even in different locations. Interpretation of them
(channel sands? carbonate mounds?) and their position relative to the
deeper high amplitude reflector (within/below--Figure
9a, or above--Figure 9b) are in question. Knowing that mixed-phase wavelets distort the
seismic image, the interpretation should be made from the zero phase
seismic data.
In
general, the zero phase wavelet provides a much sharper (broad band - zero
phase) image of the subsurface geology. Stratigraphic relationships above
2.0 seconds (Figure 9) are more clearly defined, and reflector continuity
in general (especially 2.6 seconds) is improved. Deeper in the section (Figure
10), as the earth’s filtering of the higher frequencies
increases, the lower frequencies contribute more strongly to the
wavelet’s phase characteristic (as described above). In the mixed-phase
seismic data, the non-zero (135 degrees) low-frequency (5-20 Hertz)
components begin contributing more. This adds to the distortion seen
shallow in the section (Figure 9), further reducing the ability to image
the geology accurately.
Absorption
also affects the zero phase wavelet, reducing high frequencies (narrowing
the bandwidth) and thereby stretching out the wavelet. However, since all
frequencies (5-65 Hertz) are zero phase, the seismic image provides an
accurate representation of the geology.
The
most striking improvement seen in the zero phase seismic data (Figure
10b)
is the ability to define faults more accurately. The mixed-phase
wavelet’s “beer-gut,” which has grown with depth due to absorption
(loss of high frequencies), is hanging in the fault zones. “Noses” on
the other side of the faults are smeared out by the “beer-guts” from
above. Other significant improvements seen in the zero phase seismic data
are the improved continuity of reflectors and the imaging of geologic
details needed for stratigraphic interpretations. The zero phase wavelet,
as shown in these examples, provides a more accurate image of the
subsurface geology than the mixed-phase wavelet.
Conclusion
Significant
improvements in the quality of seismic data are shown here to be easily
obtainable when wavelets are converted from mixed-phase to zero phase by
extracting the wavelet and filtering the data. This added effort to
provide seismic data that meets the zero phase assumption will improve the
accuracy of the interpreted subsurface geology and provide the correct
input to many software packages (Attributes, Amplitudes, AVO) used to
reduce exploration risks. assumption will improve the
accuracy of the interpreted subsurface geology and provide the correct
input to many software packages (Attributes, Amplitudes, AVO) used to
reduce exploration risks.
Return
to top.
|