![]() Click to view this article in PDF format.
Click to view this article in PDF format.
GCPredicting
Reservoir Properties from ![]() 3-D
3-D![]() Seismic Attributes with Little Well Control –
Jurassic Smackover Formation*
Seismic Attributes with Little Well Control –
Jurassic Smackover Formation*
By
Bruce S. Hart1
Search and Discovery Article #40046 (2002)
*Adapted for
online presentation from an article by the same author in AAPG Explorer
(April, 1999), entitled “![]() 3-D
3-D![]() Can Provide Reservoir Data.” Appreciation is
expressed to the author and to M. Ray Thomasson, former Chairman of the AAPG
Geophysical Integration Committee, and Larry Nation, AAPG Communications
Director, for their support of this online version.
Can Provide Reservoir Data.” Appreciation is
expressed to the author and to M. Ray Thomasson, former Chairman of the AAPG
Geophysical Integration Committee, and Larry Nation, AAPG Communications
Director, for their support of this online version.
1McGill University, Montreal, Quebec, Canada ([email protected]). Co-author is Bob Balch, Petroleum Recovery Research Center.
|
|
Click here for sequence of Figure 2a, 2b, 2c.
There is an increasing interest in the use of
attributes derived from
Explosive growth in interest in this approach
has led to a proliferation of methods for refining it. Multiple
regression, geostatistics, neural networks and other approaches are
being explored to help correlate log and seismic data, and then to
distribute reservoir properties throughout the area of Using a procedure known as exclusion testing, the interpretation team will use only a subset of the well database during the project’s correlation phase, then test the physical properties predictions against measurements from wells that were excluded from the calibration phase. This procedure works well when abundant well information is available, but it is not practical when only a limited number of wells penetrate the target formation – such as when the field is either small or at an early stage of development. A two-pronged methodology for assessing the results of a seismic-guided physical-properties prediction can be used to reduce risk when only limited well control is available. The methodology involves:
This approach is illustrated herein with an example from the Jurassic Smackover Formation. Testing the ModelAppleton Field is a small field (840 aces, 13 wells, of which four were producing in 1997) in southwestern Alabama (Figure 1). Unlike other Smackover fields, where high energy shoal carbonates are the primary productive intervals in the formation, here the best production is from a dolomitized algal buildup that developed over a paleobasement high located landward of the Jurassic shelf margin. True vertical depth to the top of the formation in the Appleton generally exceeds 3,800 meters (12,500 feet), and most wells are deviated, to variable extents.
The data set for this project consisted of
wireline log information from 10 wells (deemed to be too few for
exclusion testing), production data and a The model results showed that:
Comparison of the model results to
corresponding transects through the seismic data (Fig.
2c; note that the
model result is noise free, whereas the data are somewhat noisy) allowed
the horizons of importance to be identified and mapped in the An empirical relationship was then sought between seismic attributes and log properties that could be used to predict the thickness of the porosity zone (defined by a 12 percent porosity cut-off) away from existing wells. Over 30 seismic attributes – a relatively small number compared to some studies – were derived and analyzed. Multiple regression techniques established a polynomial expression between the thickness of the porosity zone and three attributes:
Values for these three attributes – for the
entire Results
To help assess the validity of this
prediction, one of the initial 2-D seismic models was refined, and the
results were exported to a seismic interpretation package. From the
model results, it was possible to derive the same seismic attributes
that had been used in the physical properties calibration. The same
general trends seen in the Next, the porosity zone thickness map was compared to what is known about the field’s geology. The best – and thickest – porosity zones in the Appleton Field are considered to be developed in algal boundstones on the crest of the paleostructure, where our seismic predictions indicated. Other porosity predicted to be present on the seaward flank of the buildups might be explained as reef-front talus accumulations. Despite the porosity in the reef-front areas, they are located below the oil water contact (as derived from well control), and apparently lack updip closure. A well drilled following this study (Figure 3) encountered 21 meters (69 feet) of porosity greater than 12 percent at a location where the predicted thickness of this zone was 19 meters (62 feet). The well tested 136 BOPD. This result is considered to be a successful test of the physical properties prediction, although the structural culmination was not as well developed as predicted. Ideally, the new log information would be used to help update the existing structure map and attribute correlation parameters.
Neither the seismic modeling component nor the geologic “reality check”
of this program is intrinsically new. The potential exists, however, for
these methods to be underutilized during field development, since so
much effort is focused on the process’ mathematical (statistical)
|
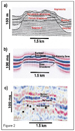 Figure 2. a. Geologic model (strike section)
of the Smackover Formation at the Appleton Field. Porous bindstones and
boundstones in the lower part of the Smackover developed preferentially
over exposed basement ridges, whereas the upper part of the formation is
essentially nonporous. The Smackover is typically non-porous throughout
its entire thickness away from the ridges. The siliciclastic Norphlet
Formation laps onto the flanks of the ridge beneath the Smackover. The
Buckner Anhydrite overlies the Smackover, and thins over the ridge
crest. A thick siliciclastic section of the Haynesville Formation caps
the zone of interest. b. Seismic model of the Appleton Field made by
convolving the geologic model with a zero phase 25 Hz Ricker wavelet.
2c. Arbitrary line through the
Figure 2. a. Geologic model (strike section)
of the Smackover Formation at the Appleton Field. Porous bindstones and
boundstones in the lower part of the Smackover developed preferentially
over exposed basement ridges, whereas the upper part of the formation is
essentially nonporous. The Smackover is typically non-porous throughout
its entire thickness away from the ridges. The siliciclastic Norphlet
Formation laps onto the flanks of the ridge beneath the Smackover. The
Buckner Anhydrite overlies the Smackover, and thins over the ridge
crest. A thick siliciclastic section of the Haynesville Formation caps
the zone of interest. b. Seismic model of the Appleton Field made by
convolving the geologic model with a zero phase 25 Hz Ricker wavelet.
2c. Arbitrary line through the  Figure 3. Attribute-based map of the
thickness of the porosity zone in the area of the Appleton Field.
Contours in meters. Bottomhole location of well drilled following this
study shown by green dot.
Figure 3. Attribute-based map of the
thickness of the porosity zone in the area of the Appleton Field.
Contours in meters. Bottomhole location of well drilled following this
study shown by green dot.