|
Introduction
Much
is being written about using  seismic seismic methods as reservoir management and
monitoring tools. However, when we try to apply these methods, there are
always issues of vertical resolution. Figure 1 illustrates the
relationship between the level of resolution and the seismic measurement
technique. methods as reservoir management and
monitoring tools. However, when we try to apply these methods, there are
always issues of vertical resolution. Figure 1 illustrates the
relationship between the level of resolution and the seismic measurement
technique.
Core
and log data provide high vertical resolution, but sample only a small
volume of rock. On the other hand, surface seismic methods sample large
rock or reservoir volumes, but have limited resolution. Surface-based
seismic methods often fail to resolve the important small-scale features
which allow one to characterize the reservoir for such applications as
flow simulations or the accurate placement of directional wells.
Crosswell
seismic profiling fills the gap between data types that provide high
resolution (but small sample volume) and data types with lower resolution
(but high sample volume).
Figure
Captions
 Figure
1. Seismic methods trade coverage of the reservoir for resolution because
it is impractical today to achieve both high resolution and high coverage.
Crosswell methods fill a resolution “gap” between sonic log
measurements and vertical seismic profiles. Figure
1. Seismic methods trade coverage of the reservoir for resolution because
it is impractical today to achieve both high resolution and high coverage.
Crosswell methods fill a resolution “gap” between sonic log
measurements and vertical seismic profiles.
 Figure
2. Crosswell data are collected by placing a seismic source in one well
and a receiver string in a nearby well. Energy which propagates directly
between wells without being scattered serves as the basis for constructing
velocity images (tomograms). Energy which is reflected is used to
construct reflection images. Figure
2. Crosswell data are collected by placing a seismic source in one well
and a receiver string in a nearby well. Energy which propagates directly
between wells without being scattered serves as the basis for constructing
velocity images (tomograms). Energy which is reflected is used to
construct reflection images.
 Figure
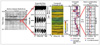
3. The crosswell reflection and velocity images (center) fill the
resolution gap between modern surface seismic data (left), and the sonic
log data (right center) and core measurements (far right). These data are
from a West Texas carbonate reservoir. Figure
3. The crosswell reflection and velocity images (center) fill the
resolution gap between modern surface seismic data (left), and the sonic
log data (right center) and core measurements (far right). These data are
from a West Texas carbonate reservoir.
Principle
Crosswell
seismic profiling is conducted between wells with the source and receivers
placed inside the wellbore, as illustrated in Figure
2. The receiver arrays are held fixed in one well while the source is
slowly drawn upwards in the other well and is “fired” at preset
intervals. After one source “run,” the receivers are relocated and the
source run is repeated. The typical spacing between adjacent source points
ranges from 2.5 feet (0.8 meter) to 20 feet (six meters). Receiver
separation is usually similar. It is possible for these systems to acquire
20,000 or more traces in a single, 24-hour day.
A
complete survey can be as small as a few thousand traces or as large as
several hundred thousand traces. Such factors as the well separation, the
thickness and structure of the imaging target, and the frequency content
of the received signal dictate the necessary size of a survey. The
distance between the source and receivers, which is on the order of the
well spacing, is considerably less than the propagation distances
associated with surface seismic methods. The short propagation distances,
combined with avoidance of weathered zones, allow the use of frequencies
at least an order of magnitude higher than used with surface seismic
methods, resulting in a proportionate increase in spatial resolution.
Crosswell
surveys currently employ a frequency band between 20 Hz and 2000 Hz,
depending on the type of source used, the distance between wells and the
attenuation characteristics of the zone under investigation. Resolution on
the order of 10 feet (3 meters) is possible. Crosswell processing is
similar to surface seismic processing in that it includes velocity
estimation (“travel time tomography”) and reflection imaging.
Reflection imaging usually provides more resolution than the velocity
image (“tomogram”) and depends critically on the accuracy of the
velocity model for good results.
In
Figure 3 comparison is made of a
crosswell velocity image and reflection image with modern surface seismic
data, a sonic log, and core data. All of these data were collected in a
carbonate reservoir in the Permian Basin of West Texas. Crosswell methods
are not a replacement for 3-D surface seismic technology in areas where
the frequency content is similar and where surface accessibility is not a
problem. It is 2-D by nature and the insufficiencies of 2-D versus 3-D
seismic data are well documented in the literature. However, by requiring
multiple profiles, a 3-D perspective can be achieved. One should view
crosswell profiling as being complementary to both surface seismic methods
and logging methods (as illustrated in Figure
1), and it is best targeted at locations where the enhanced resolution
between wells can serve a critical need.
Return
to top.
Applications
Crosswell
profiling is a technology for reservoir delineation, development,
characterization, and monitoring, but not exploration. Monitoring changes
in reservoir conditions (e.g. saturation or pressure) is easier than
absolute imaging of reservoir properties (e.g., porosity), but monitoring
requires multiple visits to the same site in order to obtain time-lapse
images. In the United States, a majority of the crosswell activity has
been in the San Joaquin Valley of California and the Permian Basin of West
Texas, but there has been recent work in the Mid-Continent and the Gulf
Coast as well.
In
the San Joaquin Valley, the primary interest has been managing the heat
budget of thermal recovery processes. The well separations are usually
small, the reservoirs shallow and the thermal recovery processes create
large velocity changes that make it easy to monitor the progress of
thermal fronts. The images used for monitoring are predominantly
time-lapse tomograms, although reflection imaging has been used as well.
The
main difficulty with using crosswell profiling in this environment is that
the sedimentary rocks are commonly quite attenuating, which can restrict
the useful upper frequency range, and a powerful source may be required to
propagate energy between wells. A second problem is that some wells will
not hold water for a sufficient period of time, which prevents the use of
fluid-coupled sources and receivers.
In
West Texas, the reservoirs are dominantly carbonates with favorable
attenuation characteristics. As a result, frequencies as great as 2,000 Hz
can propagate over hundreds or thousands of feet between wells. The high
degree of vertical variability in the acoustic impedance in these
carbonates generates many reflections helpful for reservoir
characterization. The combination of smaller well separations associated
with these mature fields and the good propagation characteristics permits
the successful use of relatively low powered, high frequency sources that
are cost-effective to deploy.
Although
there are a variety of applications for which crosswell profiling is
technically feasible, for some of them the technique is currently too
expensive to implement on a routine, operational basis. For example,
successful imaging of CO2-saturation and -pressure effects on a
vertical scale of three meters has been attained in a pilot flood in a
carbonate reservoir in West Texas, but the cost of data acquisition under
high pressure conditions, combined with the need to collect several
“snapshots” over time, may limit the routine use of the technology for
this application.
One
of the first applications where it is thought that crosswell profiling is
likely to find wide operational acceptance is in providing an accurate
“roadmap” for directional wells. It is becoming an increasingly common
practice to optimize recovery in a reservoir by targeting specific units
for a directional well. Directional wells are relatively expensive, and in
areas where the structure or stratigraphy between wells is not easily
predicted using traditional data types, crosswell methods may be the only
way to obtain the high resolution information one needs to plan where to
drill – or to make the decision as to whether to drill.
Return
to top.
Acquisition
Systems
The
acquisition systems currently available commercially are based on two
different source technologies:
·
A small airgun that is impulsive
and relatively widebanded.
·
Piezoelectric elements that are
swept in frequency in a manner similar to surface vibrators.
Both
sources are frequently used with hydrophone receiver arrays. The airgun
system has been used successfully in clastic rocks in Kansas at a well
separation exceeding 2,000 feet (600 meters), while the piezoelectric
system has been used in carbonates at a well separation of 1,800 feet (550
meters). Greater well separations are possible and are slated for future
projects. An axial hydraulic vibrator is currently under development by a
cooperative Research and Development Agreement (CRADA) between the U.S.
National Laboratories and numerous industry partners and was scheduled to
be commercially available by the time this article was published in the
AAPG Explorer. Because of its relatively high power, we expect it to be
applicable to large well separations and to other acquisition geometries,
such as that found in a 3-D reverse VSP or in a single-well mode (where
the source and receiver are in the same well).
Summary
Crosswell
images fill a resolution gap between the more traditional reservoir data
types. Crosswell velocity tomograms and reflection images exhibit
resolution better than modern surface seismic images do, but less
resolution than log measurements. For many reservoirs, information about
heterogeneities at the scale imaged by crosswell methods is critically
important.
For
some applications, crosswell technology is currently moving from being a
purely research activity to being an operational technique. Among the
current barriers it faces in gaining a wider acceptance are the cost of
data acquisition, the potential disruption to normal field operations and
insufficient experience using technology in a variety of environments. The
cost of data acquisition is dropping quickly, however, due to hardware
improvements and the expanding experience base. It is expected that future
improvements in data processing will reduce the disruption in field
operations by carefully scheduling the survey during normal maintenance
activities or before tubing is placed in a new well.
Recent advances in multi-level receiver systems
that can operate through production tubing and can be used simultaneously
in multiple wells will permit more rapid data acquisition, reduce field
disruption, and reduce costs. More and more case studies will expand the
routine acceptability of crosswell profiling . .
Return
to top.
|