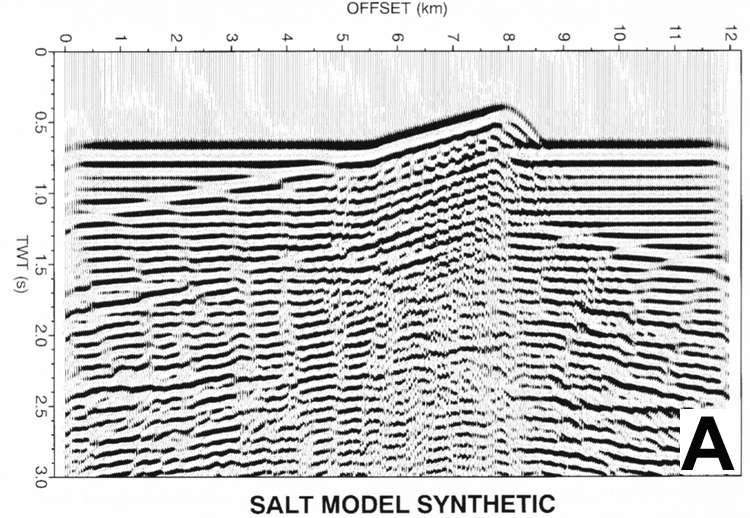
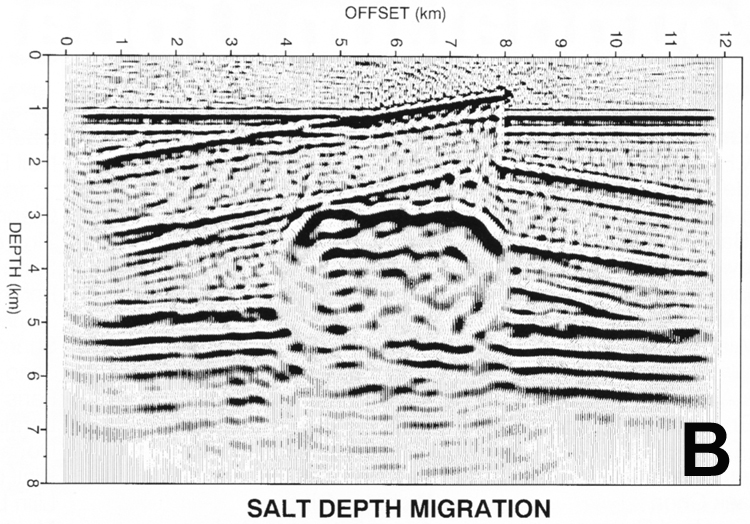
Figure 3. An example of reverse-time migration for a salt pillow model from Bording and Lines 1997 SEG publication “Seismic Modeling and Imaging With the Complete Wave Equation.” Figure 3a shows an unmigrated stacked section - few reflection events can be discerned on the seismogram. Figure 3b shows the depth image of the salt pillow obtained by reverse-time migration. The dipping seismic reflectors and the salt pillow between offsets of 4-8 kilometers and depths of 3-5 kilometers can be readily interpreted.