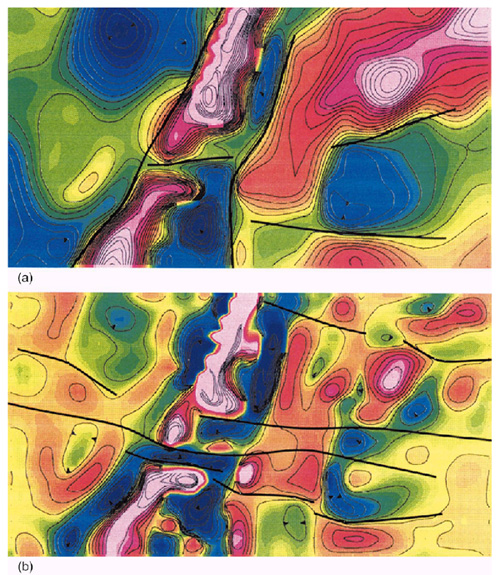
Figure 4. Filtering magnetic data is a qualitative aspect of interpretation. Graphic (a) shows total-intensity magnetic anomalies, with major trends identified. Graphic (b) shows filtered magnetic anomalies, with additional – more subtle – trends identified.