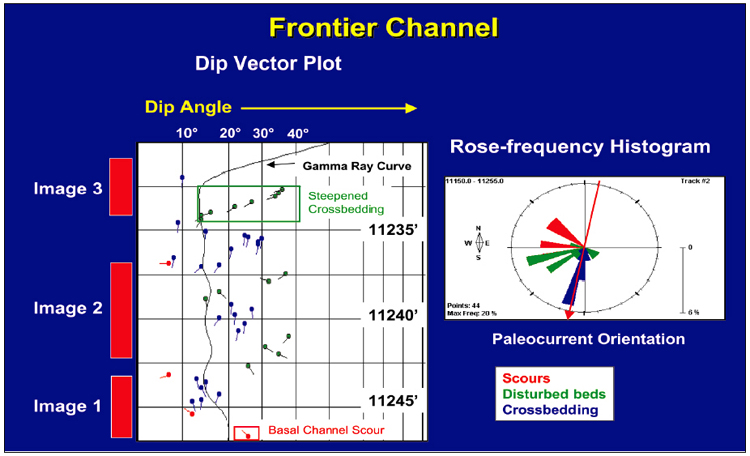
Figure 3. A dip-vector plot and rose frequency diagram illustrate how sedimentary structures are used to interpret sandstone-body geology and paleocurrent flow direction.
Figure 3. A dip-vector plot and rose frequency diagram illustrate how sedimentary structures are used to interpret sandstone-body geology and paleocurrent flow direction.