Click here to view seismic line (Figure 9) that extends through Coby #1 and Zaruba #1.
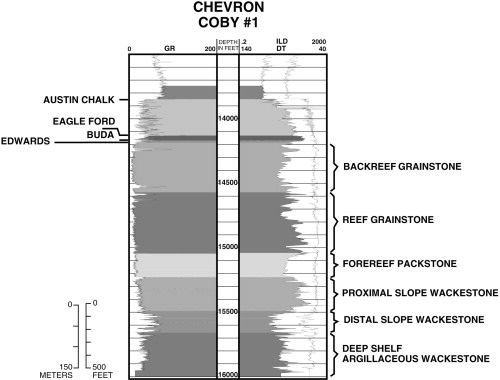
Figure 8--Logs and drill cuttings descriptions for the Chevron 1 Coby well. Logs shown from left to right are gamma ray (GR), resistivity (ILD), and sonic (DT). The lithofacies determinations are based on an examination of thin sections of drill cuttings that were taken at 10-ft (3.05 m) intervals throughout the entire Edwards/Glen Rose interval.