|
Figure Captions (1-6)
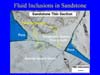 Figure 1. Fluid inclusions in sandstone in
both grains and overgrowth. Figure 1. Fluid inclusions in sandstone in
both grains and overgrowth.
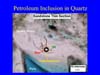 Figure 2. Petroleum inclusion in quartz grain. Figure 2. Petroleum inclusion in quartz grain.
 Figure 3. Petroleum inclusion in quartz,
ultraviolet light. Figure 3. Petroleum inclusion in quartz,
ultraviolet light.
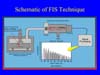 Figure 4. Schematic of FIS technique—sample
crushed in vacuum chamber with Figure 4. Schematic of FIS technique—sample
crushed in vacuum chamber with  analysis analysis by mass spectrometer to yield
mass spectrum. by mass spectrometer to yield
mass spectrum.
 Figure
5. Automated FIS instrumentation. Figure
5. Automated FIS instrumentation.
 Figure 6. FIS data. Depth plots of critical
species and compound ratios integrated with electric logs indicate
petroleum inclusion distribution seals and proximal pay. Figure 6. FIS data. Depth plots of critical
species and compound ratios integrated with electric logs indicate
petroleum inclusion distribution seals and proximal pay.
-
Fluid inclusion techniques
are flexible tools applicable to fundamental E&P problems.
-
These techniques can
increase our understanding of the petroleum system and help manage E&P
risk by assessing the present and past distribution of petroleum, its
sources and characteristics.
-
Fluid Inclusion
Stratigraphy (FIS) can help high-grade present and future prospects.
Fluid inclusions are micron-scale, fluid-filled, isolated cavities in or
between crystals in rock material (Figures 1,
2, and 3). They form
during subsurface diagenetic processes in which mineral cement is added
to intergranular pore space or microfractures. Fluid inclusions are
representative of past or near-present-day pore fluids, and they track
movement of aqueous and petroleum fluids.
Fluid inclusions may be the freshest samples
of reservoir fluids we have. They remain even after pore fluids change
(correspondingly with applications for fossil migration paths, flushed
reservoirs and tilted oil-water
contacts). Also, they record multiple charges, temperatures and
pressures.
-
Thin section based.
-
Assumes selection of the
most relevant samples for analysis.
-
Best applications are for
P-T-X
(pressure, temperature, composition) assessment; petroleum compositions typically are crudely
constrained or inferred by local production.
-
Difficult to apply to dry
gas problems.
-
Regional evaluations are
time-intensive.
Fluid Inclusion Stratigraphy (FIS) (Figures 4,
5, and 6)
-
Stratigraphic mapping of
paleofluid chemistries through bulk mass spectrometric analysis of
fluid inclusion volatile species (inorganics and organics to C13)
-
Rapid, automated analytical
system allows cost-effective, regional evaluation of thousands of
samples in a matter of days
Return
to top.
Figure
Captions (7-24)
 Figure 7. Updip prospectivity from wet well.
Fluid Inclusion Stratigraphy (FIS) of downdip dry hole documents
migration of liquids through reservoir section. FIS of subsequent oil
discovery verifies off-structure signal. Figure 7. Updip prospectivity from wet well.
Fluid Inclusion Stratigraphy (FIS) of downdip dry hole documents
migration of liquids through reservoir section. FIS of subsequent oil
discovery verifies off-structure signal.
 Figure 8. Local prospectivity / deeper
potential. Fluid Inclusion Stratigraphy (FIS) of rich gas condensate
discovery indicates gas and liquids prospectivity of area. FIS of dry
hole from same basin shows little encouragement for liquids
prospectivity. Figure 8. Local prospectivity / deeper
potential. Fluid Inclusion Stratigraphy (FIS) of rich gas condensate
discovery indicates gas and liquids prospectivity of area. FIS of dry
hole from same basin shows little encouragement for liquids
prospectivity.
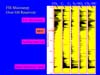 Figure 9. FIS microseep over oil reservoir.
FIS microseep in section where temperature is lower than 60oC
and above sealing interval, which overlies main reservoir sand. Figure 9. FIS microseep over oil reservoir.
FIS microseep in section where temperature is lower than 60oC
and above sealing interval, which overlies main reservoir sand.
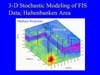 Figure 10. 3-D stochastic modeling of FIS
data; Haltenbanken area, offshore Norway. From FIS, anomalous
concentrations of methane, other light hydrocarbons, and sulfur
compounds in the shallow subsurface probably reflect anaerobic
alteration of vertically seeping gas-range compounds from depth by
sulfate-reducing bacteria. Figure 10. 3-D stochastic modeling of FIS
data; Haltenbanken area, offshore Norway. From FIS, anomalous
concentrations of methane, other light hydrocarbons, and sulfur
compounds in the shallow subsurface probably reflect anaerobic
alteration of vertically seeping gas-range compounds from depth by
sulfate-reducing bacteria.
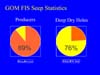 Figure 11. GOM FIS seep statistics show that
89% of producers show seepage and 76% of the deep dry holes have no
seepage. Figure 11. GOM FIS seep statistics show that
89% of producers show seepage and 76% of the deep dry holes have no
seepage.
 Figure 12. Gas vs. liquids prospectivity, at
constant depth, in the Texas Gulf Coast and offshore. Figure 12. Gas vs. liquids prospectivity, at
constant depth, in the Texas Gulf Coast and offshore.
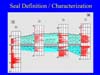 Figure
13. Seal definition / characterization documented along transect by low
methane abundance across regional seal, northern Oman. Figure
13. Seal definition / characterization documented along transect by low
methane abundance across regional seal, northern Oman.
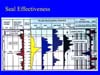 Figure
14. Seal effectiveness shown by analyses of part of the Devonian section
in a western Canada well, which, based on FIS,
appears to indicate seal breach in the
Lobstick and Ireton and evidence of a paleocolumn of gas in wet Leduc
reservoir (Compartment 3). Figure
14. Seal effectiveness shown by analyses of part of the Devonian section
in a western Canada well, which, based on FIS,
appears to indicate seal breach in the
Lobstick and Ireton and evidence of a paleocolumn of gas in wet Leduc
reservoir (Compartment 3).
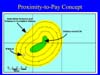 Figure 15. Proximity-to-pay concept,
illustrated by detectable benzene and toluene in formation waters. Figure 15. Proximity-to-pay concept,
illustrated by detectable benzene and toluene in formation waters.
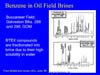 Figure 16. Benzene in oil field brines at
Buccaneer field, offshore southeast Texas, as proximity-to-pay indicator
(from Burtell and Jones; 1996)
BTEX=benzene,
toluene, ethylbenzene, xylene. Figure 16. Benzene in oil field brines at
Buccaneer field, offshore southeast Texas, as proximity-to-pay indicator
(from Burtell and Jones; 1996)
BTEX=benzene,
toluene, ethylbenzene, xylene.
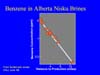 Figure 17. Benzene in Alberta Nisku brines
shows good correlation with proximity to production (from Burtell and
Jones; 1996). Figure 17. Benzene in Alberta Nisku brines
shows good correlation with proximity to production (from Burtell and
Jones; 1996).
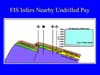 Figure 18. FIS infers nearby undrilled pay
from dry well drilled on crest (on top of Kimmeridge Clay), by detection
of anomalous levels of benzene in the lateral seal. Figure 18. FIS infers nearby undrilled pay
from dry well drilled on crest (on top of Kimmeridge Clay), by detection
of anomalous levels of benzene in the lateral seal.
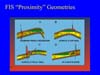 Figure 19. FIS “proximity” geometries. A.
Downdip from a reservoir. B. Across a top seal. C. Across a fault seal.
D. In a waste zone. Figure 19. FIS “proximity” geometries. A.
Downdip from a reservoir. B. Across a top seal. C. Across a fault seal.
D. In a waste zone.
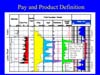 Figure 20. Pay and product definition,
Devonian Leduc reef. FIS, along with log and core analyses, delineates
gas reservoir and top seal. Figure 20. Pay and product definition,
Devonian Leduc reef. FIS, along with log and core analyses, delineates
gas reservoir and top seal.
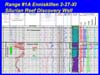 Figure 21. Pay and product definition,
Silurian Guelph reef. FIS, along with log and core analyses, delineates
oil and gas legs. Figure 21. Pay and product definition,
Silurian Guelph reef. FIS, along with log and core analyses, delineates
oil and gas legs.
 Figure 22. Identifying bypassed pay by similar
anomalies in C2, A/P
(aromatics/paraffins), and H2S in interval above
main pay. Figure 22. Identifying bypassed pay by similar
anomalies in C2, A/P
(aromatics/paraffins), and H2S in interval above
main pay.
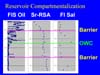 Figure
23. Reservoir compartmentalization by delineation of barriers, based on
FIS oil inclusion indicator, Sr-RSA (87Sr/86Sr
from residual salt analyses), and fluid inclusion salinities. Figure
23. Reservoir compartmentalization by delineation of barriers, based on
FIS oil inclusion indicator, Sr-RSA (87Sr/86Sr
from residual salt analyses), and fluid inclusion salinities.
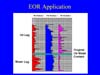 Figure 24. EOR application, as shown by the
delineation of the original oil-water contact by FIS attributes. Figure 24. EOR application, as shown by the
delineation of the original oil-water contact by FIS attributes.
Return
to top.
E&P Applications of FIS
-
Mapping migration pathways.
-
Pay delineation / relative
fluid saturation / oil-water and gas-water contacts.
-
Implying updip pay from wet
wells.
-
Implying deeper
prospectivity from shallow drilling.
-
Product type and quality
issues (sour gas, biodegradation, oil vs. gas)
-
Reservoir connectivity
-
Seal identification and
effectiveness.
-
Pressure compartments.
-
Identifying products
evolved from mature source rocks.
-
Fault location.
-
Exposure surface
delineation.
Inferring Updip Prospectivity from a Wet Well (Figure
7)
-
Well drilled off-structure
with no shows; reservoir sand was wet.
-
Strong FIS liquid and
gaseous petroleum indications were obtained on wet reservoir sand,
suggesting that oil and gas migrated through target section.
-
Updip well discovered oil
and gas in reservoir equivalent interval; API matched that measured in
thin section on wet well.
Local Prospectivity / Deeper Potential from Shallow Drilling (Figures
8, 9, 10, and
11)
-
FIS data from rich
gas-condensate discovery delineates top of pay and regional seal.
-
Shallow leakage of gas and
liquids is encouraging for deeper potential.
-
FIS data from dry hole in
same basin does not show evidence of shallow seep signature nor
migration through reservoir section.
Predicted
Drilling Success Rate (Figure 11)
Regional Evaluation (Figure
12)
-
20,000 samples from 180
wells evaluated with FIS in 6 weeks.
-
Defined areas of gas,
condensate and oil prospectivity.
-
Suggested deeper potential
in areas with shallow well control.
-
Basin-scale high-grading
tool.
Identifying Seals (Figure
13)
-
FIS methane distribution
for several wells along transect documents low abundance across
regional seal.
-
Additional FIS data
indicate that fluid on either side of seal has discrete chemistry,
suggesting limited communication over geologic time.
-
Geochemical data suggest
reservoirs produce petroleum from different source rocks.
Seal Effectiveness (Figure
14)
-
Wet Leduc reservoir.
-
FIS data provide evidence
for paleocolumn of gas.
-
Data also suggest leakage
of top seal as possible failure mode for prospect.
-
Reactivation of nearby
fault is implicated.
Proximity to Pay and Inferring Nearby Undrilled Pay (Figures
15, 16, 17,
18, and 19)
-
Well through center of
prospect encountered no reservoir; had no shows.
-
Cuttings document anomalous
levels of benzene, toluene and organic acids in the reservoir
equivalent section (the lateral seal).
-
Subsequent drilling
discovered field.
-
Geochemical halo effect can
be used to enlarge exploration target.
Pay Delineation and Bypassed Pay Application (Figures
20, 21, 22, and
23)
Shown in Figure 20 is an excellent top seal to
gas reservoir. The gas column is delineated; chemistries track porosity.
The present-day gas-water contact is defined; TSR products are
identified; and moderately sour gas is indicated. The interpretations
were verified with production tests.
Figure 21 shows the log suite, along with FIS
results, for a well that was an oil discovery, where there was a shallow
hole that was not logged. The shallow FIS anomaly is in regionally
productive interval with porosity and staining, and the chemistry is
analogous to deeper known pay zone.
FIS
Pay Delineation Statistics
-
85% of pay zones have
anomalous FIS response.
-
Distinction among
migration, paleocharge and present-day charge can be made by looking
at detailed FIS chemistry and support technologies.
EOR
Application in a Mature Field (Figure 24)
-
Depth of original oil-water
contact needed for waterflood planning.
-
Original contact was
disturbed by production.
-
Wells were incrementally
deepened over the history of field; log suites are minimal.
-
FIS data indicate the
position of the OWC.
Return
to top.
Figure
Captions (25-39)
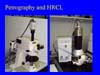 Figure
25. Petrography and HRCL
(high-resolution cathodoluminescence), as follow-up analyses. Figure
25. Petrography and HRCL
(high-resolution cathodoluminescence), as follow-up analyses.
 Figure 26. Apparatus for fluid inclusion
microthermometry. Figure 26. Apparatus for fluid inclusion
microthermometry.
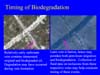 Figure 27. Timing of biodegradation. (Left)
Relatively early carbonate vein contains interpreted original and
biodegraded oil. Degradation may have occurred during vein formation.
(Right) Later vein is barren, hence may postdate both petroleum
migration and biodegradation. Collection of fluid data on inclusions
from these respective veins may help constrain timing of these events. Figure 27. Timing of biodegradation. (Left)
Relatively early carbonate vein contains interpreted original and
biodegraded oil. Degradation may have occurred during vein formation.
(Right) Later vein is barren, hence may postdate both petroleum
migration and biodegradation. Collection of fluid data on inclusions
from these respective veins may help constrain timing of these events.
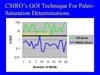 Figure 28. Example of CSIRO’s GOI
(grains containing oil inclusions)
technique
for paleo-saturation determinations shows empirical threshold separating
oil and water zones
(see
Liu
and Eadington, 2000). Figure 28. Example of CSIRO’s GOI
(grains containing oil inclusions)
technique
for paleo-saturation determinations shows empirical threshold separating
oil and water zones
(see
Liu
and Eadington, 2000).
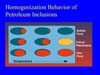 Figure 29. Homogenization behavior of
petroleum inclusions shown diagrammatically to illustrate, respectively,
bubble and dew points, along with critical phenomena. Figure 29. Homogenization behavior of
petroleum inclusions shown diagrammatically to illustrate, respectively,
bubble and dew points, along with critical phenomena.
 Figure 30. Paired oil and brine analyses help
constrain charge timing. Figure 30. Paired oil and brine analyses help
constrain charge timing.
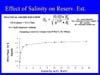 Figure 31. Effect of salinity on reserves
estimate
(from Larter and Aplin, 1996). Figure 31. Effect of salinity on reserves
estimate
(from Larter and Aplin, 1996).
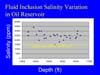 Figure 32. Fluid inclusion salinity variation
in oil reservoir. Figure 32. Fluid inclusion salinity variation
in oil reservoir.
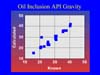 Figure 33. Oil inclusion, API gravity. Figure 33. Oil inclusion, API gravity.
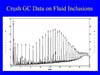 Figure 34. Crush GC
(gas chromatography) data on fluid inclusions. Figure 34. Crush GC
(gas chromatography) data on fluid inclusions.
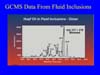 Figure 35. GCMS
(gas chromatography - mass spectrometry) data from fluid inclusions. Figure 35. GCMS
(gas chromatography - mass spectrometry) data from fluid inclusions.
 Figure 36. GCMS data from biodegraded fluid
inclusions. Figure 36. GCMS data from biodegraded fluid
inclusions.
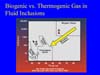 Figure 37. Biogenic vs. thermogenic gas in
fluid inclusions. Figure 37. Biogenic vs. thermogenic gas in
fluid inclusions.
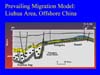 Figure 38. Prevailing migration model: Liuhua
area, Offshore China (South China Sea), with updip migration along
reservoir to well 11-1-1A. Figure 38. Prevailing migration model: Liuhua
area, Offshore China (South China Sea), with updip migration along
reservoir to well 11-1-1A.
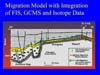 Figure
39. Migration model with integration of FIS, GCMS and isotope data,
Liuhua area, Pearl River Mouth Basin,
China, indicating a two-stage migration history from two different
source kitchens. Figure
39. Migration model with integration of FIS, GCMS and isotope data,
Liuhua area, Pearl River Mouth Basin,
China, indicating a two-stage migration history from two different
source kitchens.
Return
to top.
Follow-Up
Analyses: Tools and Information
-
Petrography (Figure
25)
-
Microthermometry (Figure
26)
-
API gravity determination (Figure
33)
-
Crush-gas chromatography
(GC) (Figure 34)
-
Thermal-extraction or solvent-extraction gas chromatography - mass
spectrometry (TE- or SE-GCMS) (Figures 35
and 36)
-
Isotopic Analysis (Figure
37)
-
Confocal laser scanning microscopy (CLSM)
-
Fluid inclusion techniques
are robust, and applicable to many fundamental E&P questions.
-
Inclusion petroleum is
unfractionated and unaltered by sampling or storage procedures.
Applicable to oil-based muds.
-
FIS allows rapid, regional
evaluation of migration, seals and proximity to pay.
-
Coupling FIS with
petrophysical data improves reservoir evaluation.
-
Coupling FIS with classical
geochemical methods improves analysis of petroleum system and
reservoir continuity.
-
FIS and conventional fluid
inclusion analyses constrain basin models.
References
Bernard, B. B., 1978, Light hydrocarbons in
marine sediments: PhD thesis, Texas A&M University, College Station,
Texas, 144 p.
Burtell and Jones, 1996, Benzene content of
subsurface brines can indicate proximity of oil, gas: Oil & Gas Journal,
June 3, 1996, p. 59-63.
Faber, E., and W.Stahl, 1984 Geochemical
Surface Exploration for Hydrocarbons in North Sea: AAPG Bulletin , v.
68, p. 363 – 386.
Larter, S.R., and A.C.
Aplin, 1996, Geochemical Application to Reservoir Assessment: AAPG Short
Course Notes.
Liu, K., and P.J. Eadington, 2000, A new
method for identifying oil migration pathways by combining analysis of
well logs and direct oil indicators (Abstract): AAPG Bulletin, v. 84,
no. 13 (annual meeting abstracts). of
well logs and direct oil indicators (Abstract): AAPG Bulletin, v. 84,
no. 13 (annual meeting abstracts).
Return
to top.
|