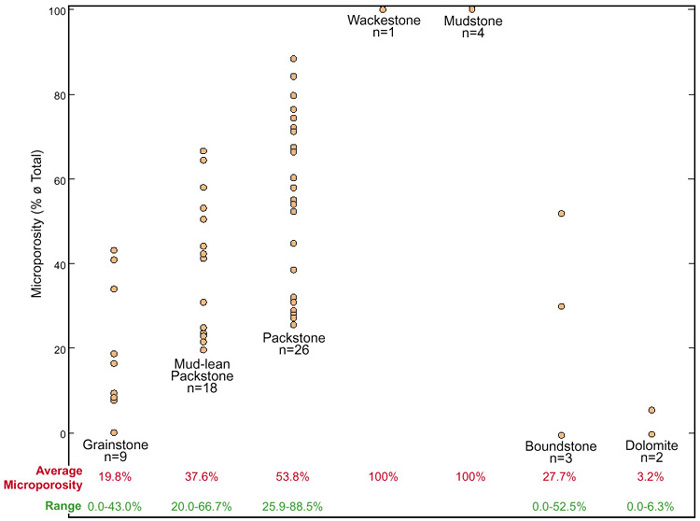
Figure 10. Cross-plot showing variation in microporosity abundance (as a percent of total pore volume) with depositional texture. The total number of samples (n) is 63.
Figure 10. Cross-plot showing variation in microporosity abundance (as a percent of total pore volume) with depositional texture. The total number of samples (n) is 63.