|
ABSTRACT
It is an
exploration “fact of life” that, while the Prospect is the economic
unit of exploration, the Play is the operational unit.
Due to the magnitude of expenditures (both money and manpower) and
time framework involved, the most difficult and critical task in
Exploration is selecting which plays in which to explore, not which
prospects to drill.
We present
a simple but powerful method for evaluating the geologic (and economic)
chance, volume and value of geologic plays. The methodology is applicable
for a spectrum of opportunities, from a medium- sized concession to a full
geologic play. This monetization approach fills an ‘analytical gap’
between traditional methods for assessing volumes and geologic chance for
plays (e. g., Baker et al., 1986,) and assessing the value of individual
prospects (e. g., Rose, 1992; White, 1993).
Required
inputs (only seven variables) are tied to company strategy (e. g.,
activity level, risk tolerance), and to units of natural measure (forecast
geologic discoveries, their size distribution, and historic success rates)
that can be validated against historical (or analog) results. The small
number of requisite input variables encourages making multiple sensitivity
cases for an exploration program.
Calculated
outputs provide powerful information that can be used to prioritize a
company’s exposure to various trends, leading to a portfolio of Plays.
The process flow can be created quickly using Microsoft Excel and its
embedded functions, as demonstrated in our poster session. Spreadsheets
can be customized to model optimal activity levels and working interest,
based upon a company’s risk tolerance.
KEY
MESSAGE
Plays
and Large Concessions can be Systematically And Objectively Evaluated for Undiscovered Potential -- Volumes,
Value, and Chance of Success -- Just Like Prospects
Return
to top.
INPUTS:
PROSPECT VS. PLAY
Many terms are common to both
analyses. Due to  uncertainties uncertainties associated with prediction, input variables
should be entered as probabilistic ranges (e. g., P10/ P90). associated with prediction, input variables
should be entered as probabilistic ranges (e. g., P10/ P90).
Prospect
-
Geologic Chance Factors
-
Area
-
Average Net Pay
-
Recovery Per Unit
-
Dry Hole Cost
-
Net Present Value Per
Barrel Found ($/BOE)
-
Minimum COMMERCIAL Field
Size
Play
-
Geologic Chance Factors
(Shared and Local)
-
Projected Field Number
Distribution
-
Projected Field Size
Distribution
-
Projected Dry Hole
Tolerance (# Consecutive Dry Holes Drilled Before Exiting Play)
-
Total Dollars Exposed
(Failure Costs)
-
Net Present Value Per
Barrel Found ($/BOE)
-
Minimum ECONOMIC Field Size
THE
GOAL: EXPECTED VALUE--PROSPECT VS. PLAY
 Figure
1. Prospect expected value. Figure
1. Prospect expected value.
 Figure
2. Concession / play expected value. Figure
2. Concession / play expected value.
Return
to top.
Prospect
Expected Value (Figure 1):
(Chance
of Success X Success Case Value) LESS (Chance of Failure X
Dry Hole cost)
Concession
/ Play Expected Value (Figure
2):
(Chance of
Program Economic Success X (Success Case Value) LESS (Chance Program Failure) X (Dry Hole Program Cost [Failure Cost])
Expected Value (EV) is calculated
by subtracting the chance-weighted capital exposure (funds at total risk)
from the chance-weighted value, given success. Investing in a large number
of projects with a positive Expected Value improves chance of profit.
For a prospect, generally one test
is tolerated, with an associated ‘dry hole’ cost (cost to generate and
drill the prospect). Success case value is estimated from a full-cycle
cash flow analysis of field development, given a discovery.
For a family of prospects, a
minimum program is modeled, reflecting the number of consecutive dry holes
that would be tolerated before abandoning the play. The chance reflects
the probability of making at least one economic discovery, and the ‘dry
hole’ costs, are those associated with that minimum program.
Success
case value is based upon the economic volumes found, given that the play
proves economically viable and the modeled success-case exploration
program is executed.
THE
PLAY EVALUATION PROCESS
The play
evaluation process requires the following:
1.
Delineation of ‘Play’
2.
Assessment of Geologic Chance
3.
Assessment of Dry Hole Tolerance and Minimum Program Costs
4.
Estimate of Success Case Activity Levels
5.
Estimate of Economic Threshold Size and Value Per BOE/MCFE
6.
Selection of Appropriate Field Size Distribution
Return
to top.
1.
Play Delineation
The
play should consist of prospects with similar geologic character and
history.
Assessors
should agree on the time period being analyzed (typically 5 years, 10
years, or total play life).
Decide if the assessment is for total industry, or just the
prospects in which your company will participate.
To
‘value’ a play for a company (recommended), inputs should reflect
company dry hole tolerance and success case activity levels.
2.
Assessment of Geologic Chance
 Figure
3. Chance assessment for prospect. Figure
3. Chance assessment for prospect.
For
an individual prospect, detectable oil or gas is either present or not –
much like an on / off switch.
 Figure
4. Chance assessment for play. Figure
4. Chance assessment for play.
Considering
the family of prospects in Figure 4, as yet untested, there are elements
of geologic chance that could condemn them all -- Shared Chance Factors.
Also,
there are variables that can result in some being successful while others
fail--Local Chance Factors.
The
product of the Shared Chance Factors is called Play Chance—the chance
that the play is viable. In proven plays this value is often set to
certainty (1.0). Statistically, these factors are treated dependently.
The
product of the Local Chance Factors is called Prospect Success Ratio --
the percentage of prospects that will be viable, if the overall play
works. Statistically, these factors are treated independently.
This
subdivision of chance is crucial to assessing the chance of program
success, as explained below.
3.
Assessment of Dry Hole Tolerance and Minimum Program Costs
“How
many totally dry holes would my company tolerate drilling prior to
abandoning this play?”
This estimate is
based upon:
·
Company’s track record in
similar plays
·
Variability of prospects
·
In some cases, minimum well
commitment(s)
All costs
associated with this minimum program must also be estimated (wells /
seismic / land / manpower).
4.
Estimate of Success Case Activity Levels
Estimate the
level of exploration activity for the time period being analyzed, given
that there will be at least one economic discovery made in the play.
To calculate overall play
volumetric potential, enter a range for number of undrilled prospects, or
predicted number of discoveries.
To model volumes captured by your
company, enter a range for the number of prospects in which your company
will participate, based upon:
·
Company budget size
·
Number of prospects in
inventory, or number that is reasonable to assume could be acquired
·
Time period being analyzed
5.
Estimate of Economic Threshold Size and Value Per BOE/MCFE
“How
large a field must we find to recover all full-cycle costs? What is a
reasonable estimate for NPV per barrel / MCF for fields that will be found
in this play?"
In addressing these questions, consideration should be given
to:
·
Time value of money
·
Time period being evaluated
·
Current infrastructure
Return
to top.
6.
Selection of Appropriate Field Size Distribution
 Figure 5.
Lognormal distribution of field sizes. Figure 5.
Lognormal distribution of field sizes.
 Figure 6.
Future field size distribution. It should reflect the size range from
smallest detectable (‘geologic’) discovery up to the largest future
discovery remaining to be found in the play. The threshold size is then
used to estimate P(MEFS), the probability that any given discovery will
exceed threshold (80% in this example). The size characteristics of just
those fields exceeding the economic minimum (dashed yellow line) are used
to calculate the economic volumes found, given success in the play. Figure 6.
Future field size distribution. It should reflect the size range from
smallest detectable (‘geologic’) discovery up to the largest future
discovery remaining to be found in the play. The threshold size is then
used to estimate P(MEFS), the probability that any given discovery will
exceed threshold (80% in this example). The size characteristics of just
those fields exceeding the economic minimum (dashed yellow line) are used
to calculate the economic volumes found, given success in the play.
Choosing
the appropriate size distribution for FUTURE discoveries is crucial to
realistic assessment of undiscovered volumes and value.
The
distribution must reflect that the largest fields are often (but not
always) found early in the ‘life’ of a play.
Fields tend to
distribute themselves lognormally; that is, field sizes form a straight
line on log - probability plots (Figure 5).
The future field
size distribution should reflect the size range from smallest detectable
(‘geologic’) discovery up to the largest future discovery remaining to
be found in the play.
The threshold
size is then used to estimate P(MEFS), the probability that any given
discovery will exceed threshold (80% in the example in Figure
6). The size
characteristics of just those fields exceeding the economic minimum
(dashed yellow line in Figure 6) are used to calculate the economic
volumes found, given success in the play.
CALCULATIONS
AND OUTPUT
Play /
Concession Expected Value =
(Chance of
Success X Value Generated) minus ((1-Chance of Success) X Failure cost)
Chance
of Success
 Figure
7. Definition and example calculation of chance of success. Figure
7. Definition and example calculation of chance of success.
This
term represents the chance that at least one economic discovery will be
made with the minimum program specified in Step 3 = Program Pe (Figure
7).
Since
Local Chance Factors are treated independently, the chance of program
success is simply one minus the product of all chances of total failure,
as shown in the example in Figure 7.
Shared
/ play chance factors are shared by all prospects and are therefore kept
as a constant in the calculation.
The
number of dry holes tolerated has a pronounced effect on calculated chance
of program success, particularly on the low end (e. g., 1 vs. 2, 2 vs. 3
dry holes tolerated).
Return
to top.
Value
Generated
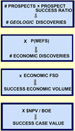 Figure 8.
Diagram of factors yielding success case value. Figure 8.
Diagram of factors yielding success case value.
This
term, presented in Figure 8, represents value generated, given some
success in the play, and that the success-case exploration program defined
in Step 4 is executed.
Example
Calculation
 Figure
9. Example Calculation. Figure
9. Example Calculation.
Example
Calculation in Figure 9 is based upon single- point input (we favor using
probabilistic ranges). Dry hole exposure is the sum of all costs to
execute the minimum program of 3 wells (company share). Play is assumed to
be proven in this example (Play Chance = 1. 0).
Note
that the success-case NPV is burdened with the costs of dry holes
associated with the successful program. of dry holes
associated with the successful program.
Comparative
Measures—Prospect Scale Vs. Program / Play Scale
 Figure
10. Comparative measures—prospect scale vs. program / play scale. These
are the key output variables from the analysis that can be incorporated
into a business model for ranking a global portfolio of plays. Figure
10. Comparative measures—prospect scale vs. program / play scale. These
are the key output variables from the analysis that can be incorporated
into a business model for ranking a global portfolio of plays.
The
factors listed in Figure 10 are the key output variables from the analysis
that can be incorporated into a business model for ranking a global
portfolio of plays.
This
methodology has been coded into a user- friendly, Excel®- based software
package that facilitates the analysis.
REFERENCES
Baker,
R.A., H. M. Gehman, W. R. James, D. A. White, 1986, Geologic
Field Number and Size Assessment of Oil and Gas Plays, in Oil
and Gas Assessment: Methods and Applications: AAPG Studies in Geology No.
21, p. 25 – 31.
Rose,
P.R., 1992, Chance
of Success and Its Use in Petroleum Exploration: Chapter 7: Part II.
Nature of the Business
in The Business of Petroleum Exploration: AAPG
Treatise of Petroleum Geology, p. 71 – 86.
White,
D.A., 1993, Geologic Risking Guide for Prospects and Plays: AAPG Bulletin,
v. 77, p. 2048 – 2061.
Return
to top.
|