![]() Predicting
Predicting![]()
![]() Sandstone
Sandstone![]()
![]() Reservoir
Reservoir![]() System Quality and Example of Petrophysical Evaluation*
System Quality and Example of Petrophysical Evaluation*
Dan J. Hartmann, Edward A. Beaumont, and Edward Coalson
Search and Discovery Article #40005 (2000)
*Adaptation
and revision for online presentation of part of Chapter 9, ![]() Predicting
Predicting![]()
![]() Reservoir
Reservoir![]() System Quality and Performance, by Dan J. Hartmann and Edward A. Beaumont, in
Exploring for Oil and Gas Traps, Edward A. Beaumont and Norman H. Foster, eds.,
Treatise of Petroleum Geology, Handbook of Petroleum Geology, 1999.
System Quality and Performance, by Dan J. Hartmann and Edward A. Beaumont, in
Exploring for Oil and Gas Traps, Edward A. Beaumont and Norman H. Foster, eds.,
Treatise of Petroleum Geology, Handbook of Petroleum Geology, 1999.
![]() Predicting
Predicting![]()
![]() Sandstone
Sandstone![]()
![]() Porosity
Porosity![]() and Permeability
and Permeability
![]() Sandstone
Sandstone![]() Diagenetic Processes
Diagenetic Processes
Effect of Composition and Texture on
![]() Sandstone
Sandstone![]() Diagenesis
Diagenesis
Hydrology and ![]() Sandstone
Sandstone![]() Diagenesis
Diagenesis
Influence of Depositional Environment on ![]() Sandstone
Sandstone![]() Diagenesis
Diagenesis
![]() Predicting
Predicting![]()
![]() Sandstone
Sandstone![]()
![]() Reservoir
Reservoir![]()
![]() Porosity
Porosity![]()
![]() Predicting
Predicting![]()
![]() Sandstone
Sandstone![]() Permeability from Texture
Permeability from Texture
Estimating ![]() Sandstone
Sandstone![]() Permeability from Cuttings
Permeability from Cuttings
Example of Petrophysical Evaluation: Evaluation of Saturation Profiles
Setting and Structure of the Sorrento Field
Morrow Lithofacies and Pore Types
Sorrento Water Saturation Calculations
Petrophysical Analysis of Sorrento Field Wells
Water Saturation Profile for Sorrento Field
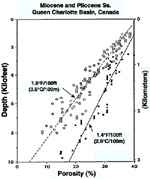 Figure 1.
![]() Porosity
Porosity![]() -depth plot for sandstones from two wells with different
geothermal gradients. From Wilson, 1994a; courtesy SEPM.
-depth plot for sandstones from two wells with different
geothermal gradients. From Wilson, 1994a; courtesy SEPM.
 Figure 2. Effects
of sediment composition on mechanical stability and chemical stability. From
Loucks et al., 1984; courtesy AAPG.
Figure 2. Effects
of sediment composition on mechanical stability and chemical stability. From
Loucks et al., 1984; courtesy AAPG.
 Figure 3. Water
movement processes—meteroic, compactional, and thermobaric. After Galloway,
1984, and Harrison and Tempel, 1993; courtesy AAPG.
Figure 3. Water
movement processes—meteroic, compactional, and thermobaric. After Galloway,
1984, and Harrison and Tempel, 1993; courtesy AAPG.
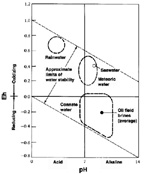 Figure 4. Eh-pH
diagram, showing the approximate distribution of various types of subsurface
fluids. From Shelley, 1985; courtesy W.H. Freeman and Co.
Figure 4. Eh-pH
diagram, showing the approximate distribution of various types of subsurface
fluids. From Shelley, 1985; courtesy W.H. Freeman and Co.
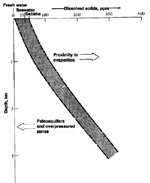 Figure 5.
![]() Figure 6.
Factors controlling
Figure 6.
Factors controlling ![]() sandstone
sandstone![]() diagenesis. From Stonecipher et al., 1984;
courtesy AAPG.
diagenesis. From Stonecipher et al., 1984;
courtesy AAPG.
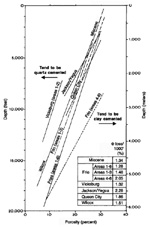 Figure 9.
![]() Porosity
Porosity![]() -depth plot of various formations in U.S. Gulf Coast region. From
Loucks et al., 1984; courtesy AAPG.
-depth plot of various formations in U.S. Gulf Coast region. From
Loucks et al., 1984; courtesy AAPG.
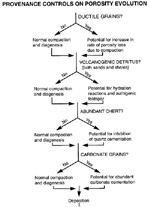 Figure 10.
Provenance controls on
Figure 10.
Provenance controls on ![]() porosity
porosity![]() evolution. From Surdam et al., 1989;
courtesy RMAG.
evolution. From Surdam et al., 1989;
courtesy RMAG.
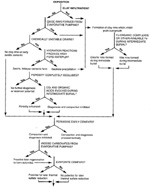 Figure 11.
Effects of near-surface diagenesis on
Figure 11.
Effects of near-surface diagenesis on ![]() sandstone
sandstone![]()
![]() porosity
porosity![]() . From Surdam et al.,
1989; courtesy RMAG.
. From Surdam et al.,
1989; courtesy RMAG.
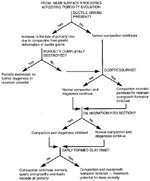 Figure 12.
Effects of mechanical diagenesis on
Figure 12.
Effects of mechanical diagenesis on ![]() sandstone
sandstone![]()
![]() porosity
porosity![]() . From Surdam et
al., 1989; courtesy RMAG.
. From Surdam et
al., 1989; courtesy RMAG.
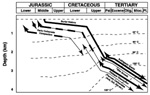 Figure 13.
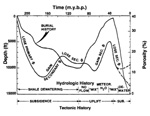 Figure 14.
Use of burial history in
Figure 14.
Use of burial history in ![]() predicting
predicting![]()
![]() sandstone
sandstone![]()
![]() porosity
porosity![]() . From Hayes, 1983;
courtesy AAPG.
. From Hayes, 1983;
courtesy AAPG.
 Figure 15.
Effect of grain size on permeability and
Figure 15.
Effect of grain size on permeability and ![]() porosity
porosity![]() . From Coalson et al.,
1990.
. From Coalson et al.,
1990.
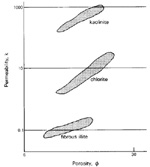 Figure 16.
![]() Porosity
Porosity![]() -permeability relationships for kaolinite-, chlorite-, and
illite-emented sandstones. From North, 1985; courtesy Allen & Unwin.
-permeability relationships for kaolinite-, chlorite-, and
illite-emented sandstones. From North, 1985; courtesy Allen & Unwin.
![]() Figure 17.
Types of clay-mineral occurrences and pore geometry.After Neasham, 1977;
courtesy SPE.
Figure 17.
Types of clay-mineral occurrences and pore geometry.After Neasham, 1977;
courtesy SPE.
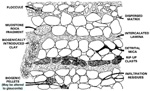 Figure 18.
Types of detrital clay in
Figure 18.
Types of detrital clay in ![]() sandstone
sandstone![]() . After Wilson and Pittman, 1977;
courtesy Journal of Sedimentary Petrology.
. After Wilson and Pittman, 1977;
courtesy Journal of Sedimentary Petrology.
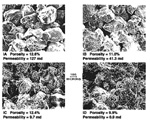 Figure
19. SEM photographs of pore types IA, IB, IC, ID in sandstones. From Sneider and
King, 1984; courtesy AAPG.
Figure
19. SEM photographs of pore types IA, IB, IC, ID in sandstones. From Sneider and
King, 1984; courtesy AAPG.
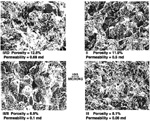 Figure
20.
Figure
20.
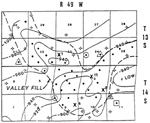 Figure
22. Structure map with outline of valley fill. Modified from Sonnenberg, 1985;
courtesy RMAG.
Figure
22. Structure map with outline of valley fill. Modified from Sonnenberg, 1985;
courtesy RMAG.
 Figure
23. Ka/F cross plot for well
11 (Figure 22). From Hartmann and Coalson, 1990; courtesy RMAG.
Figure
23. Ka/F cross plot for well
11 (Figure 22). From Hartmann and Coalson, 1990; courtesy RMAG.
 Figure
24. Family of capillary-pressure
curves. From Hartmann and Coalson, 1990; courtesy RMAG.
Figure
24. Family of capillary-pressure
curves. From Hartmann and Coalson, 1990; courtesy RMAG.
 Figure
25.
Figure
25.
 Figure
26.
Figure
26.
 Figure
27.
Figure
27.
 Figure
28.
Figure
28.
 Figure
29. Petrophysical characteristics of well 8 (Figure 22). From Hartmann and
Coalson, 1990; courtesy RMAG.
Figure
29. Petrophysical characteristics of well 8 (Figure 22). From Hartmann and
Coalson, 1990; courtesy RMAG.
 Figure
30. Petrophysical characteristics of well 1 (Figure 22). From Hartmann and
Coalson, 1990; courtesy RMAG.
Figure
30. Petrophysical characteristics of well 1 (Figure 22). From Hartmann and
Coalson, 1990; courtesy RMAG.
 Figure
31. Sw-elevation plot for wells 4, 8, 11 (Figure 22). From Hartmann
and Coalson, 1990; courtesy RMAG.
Figure
31. Sw-elevation plot for wells 4, 8, 11 (Figure 22). From Hartmann
and Coalson, 1990; courtesy RMAG.
Table 1.
Comparison of variables affecting ![]() reservoir
reservoir![]() quality in sandstones and
carbonates. After Choquette and Pray (1970).
quality in sandstones and
carbonates. After Choquette and Pray (1970).
Table 2.
Major diagenetic processes and their impact on ![]() porosity
porosity![]() . From Surdam et
al. (1989).
. From Surdam et
al. (1989).
Table 3. Cements in sandtones, associated water chemistry, and derivation.
Table 4. Cements vs. facies/environments.
Table 5.
Range in values of parameters Scherer (1987) used in his analysis of
![]() sandstone
sandstone![]() reservoirs.
reservoirs.
Table 6. Characteristics of pore types I, II, and III.
The economic
success of any prospect ultimately depends on ![]() reservoir
reservoir![]() system performance. The
system performance. The
![]() reservoir
reservoir![]() system controls two critical economic elements of a prospect: (1) the
rate and (2) the amount of hydrocarbons recovered. In geologic terms, pore type
and pore-fluid interaction are the most important elements determining
system controls two critical economic elements of a prospect: (1) the
rate and (2) the amount of hydrocarbons recovered. In geologic terms, pore type
and pore-fluid interaction are the most important elements determining ![]() reservoir
reservoir![]() system performance. Understanding how
system performance. Understanding how ![]() reservoir
reservoir![]() systems behave on a
petrophysical basis helps us predict
systems behave on a
petrophysical basis helps us predict ![]() reservoir
reservoir![]() system behavior in wildcat
situations.
system behavior in wildcat
situations.
The
interrelationship of ![]() reservoir
reservoir![]()
![]() porosity
porosity![]() , permeability, thickness, and lateral
distribution determines
, permeability, thickness, and lateral
distribution determines ![]() reservoir
reservoir![]() system quality. Although quality prediction is
most effective with large amounts of superior data, useful predictions can still
be made from very limited data. This article discusses methods for
system quality. Although quality prediction is
most effective with large amounts of superior data, useful predictions can still
be made from very limited data. This article discusses methods for ![]() predicting
predicting![]() the quality of
the quality of ![]() sandstone
sandstone![]()
![]() reservoir
reservoir![]() systems.
systems.
Sandstones and
carbonates are the dominant ![]() reservoir
reservoir![]() rocks. Although quite similar, they are
different. Table 1 (after Choquette and Pray, 1970) compares variables affecting
rocks. Although quite similar, they are
different. Table 1 (after Choquette and Pray, 1970) compares variables affecting
![]() reservoir
reservoir![]() system quality for sandstones vs. carbonates.
system quality for sandstones vs. carbonates.
![]() Predicting
Predicting![]()
![]() Sandstone
Sandstone![]()
![]() Porosity
Porosity![]() and Permeability
and Permeability
General Statement
An effective
method of ![]() predicting
predicting![]()
![]() sandstone
sandstone![]()
![]() reservoir
reservoir![]() system
system ![]() porosity
porosity![]() and permeability is (1)
to predict
and permeability is (1)
to predict ![]() sandstone
sandstone![]()
![]() porosity
porosity![]() and permeability at deposition and then (2) to
predict the probable changes to
and permeability at deposition and then (2) to
predict the probable changes to ![]() porosity
porosity![]() and permeability as the
and permeability as the ![]() sandstone
sandstone![]() was
buried. Since other texts (Barwis et al., 1989; Galloway and Hobday, 1983) cover
the impact of depositional environment on
was
buried. Since other texts (Barwis et al., 1989; Galloway and Hobday, 1983) cover
the impact of depositional environment on ![]() porosity
porosity![]() and permeability, this
subsection concentrates on
and permeability, this
subsection concentrates on ![]() predicting
predicting![]()
![]() porosity
porosity![]() and permeability by considering
the effects of diagenesis.
and permeability by considering
the effects of diagenesis.
This section contains the following topics:
![]() Sandstone
Sandstone![]() Diagenetic Processes
Diagenetic Processes
Diagenesis alters
the original pore type and geometry of a ![]() sandstone
sandstone![]() and therefore controls its
ultimate
and therefore controls its
ultimate ![]() porosity
porosity![]() and permeability. Early diagenetic patterns correlate with
environment of deposition and sediment composition. Later diagenetic patterns
cross facies boundaries and depend on regional fluid migration patterns (Stonecipher
and May, 1992). Effectively
and permeability. Early diagenetic patterns correlate with
environment of deposition and sediment composition. Later diagenetic patterns
cross facies boundaries and depend on regional fluid migration patterns (Stonecipher
and May, 1992). Effectively ![]() predicting
predicting![]()
![]() sandstone
sandstone![]() quality depends on
quality depends on ![]() predicting
predicting![]() diagenetic history as a product of depositional environments, sediment
composition, and fluid migration patterns.
diagenetic history as a product of depositional environments, sediment
composition, and fluid migration patterns.
Diagenetic Processes
![]() Sandstone
Sandstone![]() diagenesis occurs by three processes:
diagenesis occurs by three processes:
-
Cementation
-
Dissolution (leaching)
-
Compaction
Cementation
destroys pore space; grain leaching creates it. Compaction decreases ![]() porosity
porosity![]() through grain rearrangement, plastic deformation, pressure solution, and
fracturing.
through grain rearrangement, plastic deformation, pressure solution, and
fracturing.
Diagenetic Zones
Surdam et al. (1989) define diagenetic zones by subsurface temperatures. Depending on geothermal gradient, depths to these zones can vary. Table 2 summarizes major diagenetic processes and their impact on pore geometry.
Effect of Temperature
Depending on
geothermal gradient, the effect of temperature on diagenesis can be significant.
Many diagenetic reaction rates double with each 10oC increase (1000
times greater with each 100oC) (Wilson, 1994a). Increasing
temperatures increase the solubility of many different minerals, so pore waters
become saturated with more ionic species. Either (1) ![]() porosity
porosity![]() -depth plots of
sandstones of the target
-depth plots of
sandstones of the target ![]() sandstone
sandstone![]() that are near the prospect area or (2)
computer models that incorporate geothermal gradient are probably best for
that are near the prospect area or (2)
computer models that incorporate geothermal gradient are probably best for
![]() porosity
porosity![]() predictions.
predictions.
Figure 1 is a
![]() porosity
porosity![]() -depth plot for sandstones from two wells with different geothermal
gradients. The well with the greater geothermal gradient has correspondingly
lower porosities than the well with lower geothermal gradient. At a depth of
7000 ft, there is a 10%
-depth plot for sandstones from two wells with different geothermal
gradients. The well with the greater geothermal gradient has correspondingly
lower porosities than the well with lower geothermal gradient. At a depth of
7000 ft, there is a 10% ![]() porosity
porosity![]() difference in the trend lines.
difference in the trend lines.
Effect of Pressure
The main effect
of pressure is compaction. The process of ![]() porosity
porosity![]() loss with depth of burial is
slowed by overpressures. Basing his findings mainly on North Sea sandstones,
Scherer (1987) notes sandstones retain approximately 2%
loss with depth of burial is
slowed by overpressures. Basing his findings mainly on North Sea sandstones,
Scherer (1987) notes sandstones retain approximately 2% ![]() porosity
porosity![]() for every 1000
psi of overpressure during compaction. He cautions this figure must be used
carefully because the influence of pressure on
for every 1000
psi of overpressure during compaction. He cautions this figure must be used
carefully because the influence of pressure on ![]() porosity
porosity![]() depends on the stage of
compaction at which the overpressure developed.
depends on the stage of
compaction at which the overpressure developed.
Effect of Age
In general,
sandstones lose ![]() porosity
porosity![]() with age. In other words,
with age. In other words, ![]() porosity
porosity![]() loss in
loss in ![]() sandstone
sandstone![]() is
a function of time. According to Scherer (1987), a Tertiary
is
a function of time. According to Scherer (1987), a Tertiary ![]() sandstone
sandstone![]() with a
Trask sorting coefficient of 1.5, a quartz content of 75%, and a burial depth of
3000 m probably has an average
with a
Trask sorting coefficient of 1.5, a quartz content of 75%, and a burial depth of
3000 m probably has an average ![]() porosity
porosity![]() of approximately 26%. A Paleozoic
of approximately 26%. A Paleozoic
![]() sandstone
sandstone![]() with the same sorting, quartz content, and burial depth probably has
an average
with the same sorting, quartz content, and burial depth probably has
an average ![]() porosity
porosity![]() of approximately 13%.
of approximately 13%.
Effect of
Composition and Texture on ![]() Sandstone
Sandstone![]() Diagenesis
Diagenesis
Composition and Diagenesis
Composition
affects ![]() sandstone
sandstone![]() diagenesis in two ways:
diagenesis in two ways:
-
The higher the quartz content, the greater the mechanical stability (less compaction occurs).
-
The higher the variety of minerals, the lower the chemical stability (more cementation or dissolution occurs).
Sandstones with
abundant lithics, feldspars, or chert have less occlusion of ![]() porosity
porosity![]() by quartz
overgrowths and more secondary
by quartz
overgrowths and more secondary ![]() porosity
porosity![]() through dissolution of less stable
grains. The ratio of quartz to ductile grains is key to compaction
through dissolution of less stable
grains. The ratio of quartz to ductile grains is key to compaction ![]() porosity
porosity![]() loss.
loss.
Sediment Composition and Provenance
Provenance determines sand grain mineralogy and sediment maturity. Mechanical and chemical weathering affects sand grains during transportation. The final product reflects the origin, amount of reworking, and transport distance.
For example, sandstones derived from subduction trench margins are generally mineralogically immature. They often contain terrigenous detritus with abundant volcaniclastics and pelagic material. Sandstones derived from the margin of a cratonic basin tend to be mineralogically and texturally mature and contain reworked sedimentary detritus.
Figure 2 summarizes the effects of sediment composition on mechanical stability and chemical stability.
Influence of Grain Size on ![]() Porosity
Porosity![]() and Diagenesis
and Diagenesis
Sorting and grain
size are textural parameters that intuitively might seem to have the same
effects on the ![]() porosity
porosity![]() of a
of a ![]() reservoir
reservoir![]() system
system ![]() sandstone
sandstone![]() . Studies show, however,
that
. Studies show, however,
that ![]() porosity
porosity![]() is largely independent of grain size for unconsolidated sand of
the same sorting (Beard and Weyl, 1973). Size does affect permeability; the
finer the sand, the lower the permeability. Permeability indirectly affects
is largely independent of grain size for unconsolidated sand of
the same sorting (Beard and Weyl, 1973). Size does affect permeability; the
finer the sand, the lower the permeability. Permeability indirectly affects
![]() porosity
porosity![]() through diagenesis. Stonecipher et al. (1984) suggest that slow fluid
fluxes, resulting from low permeability, promote cementation; rapid fluxes
promote leaching. In rapid fluxes, solutes do not remain in pore spaces long
enough to build local concentration that promotes precipitation of cement. In
slow fluxes, they do. Also, size affects the surface area available for
diagenetic reactions: the finer the grain size, the greater the grain surface
area for a volume of sediment or rock.
through diagenesis. Stonecipher et al. (1984) suggest that slow fluid
fluxes, resulting from low permeability, promote cementation; rapid fluxes
promote leaching. In rapid fluxes, solutes do not remain in pore spaces long
enough to build local concentration that promotes precipitation of cement. In
slow fluxes, they do. Also, size affects the surface area available for
diagenetic reactions: the finer the grain size, the greater the grain surface
area for a volume of sediment or rock.
Influence
of Sorting on ![]() Porosity
Porosity![]()
Sorting and
![]() porosity
porosity![]() strongly correlate in unconsolidated sandstones (Beard and Weyl, 1973).
The better the sorting, the higher the
strongly correlate in unconsolidated sandstones (Beard and Weyl, 1973).
The better the sorting, the higher the ![]() porosity
porosity![]() . The initial porosities of wet,
unconsolidated sands show a range of 44-28%
. The initial porosities of wet,
unconsolidated sands show a range of 44-28% ![]() porosity
porosity![]() for well-sorted vs. poorly
sorted grains. Well-sorted sands tend to have a higher percentage of quartz than
do poorly sorted sands, and they tend to maintain higher porosities during
burial than poorly sorted sands. Poorly sorted sands have more clay matrix and
nonquartz grains.
for well-sorted vs. poorly
sorted grains. Well-sorted sands tend to have a higher percentage of quartz than
do poorly sorted sands, and they tend to maintain higher porosities during
burial than poorly sorted sands. Poorly sorted sands have more clay matrix and
nonquartz grains.
Hydrology and
![]() Sandstone
Sandstone![]() Diagenesis
Diagenesis
Type of Water Flushes
Much diagenesis occurs in open chemical systems whose initial chemistry is set at deposition. After that, the chemistry of the system changes as flowing water moves chemical components through pores and causes either leaching or cementation of grains. Diffusion also moves chemicals in and out of rocks, although at significantly lower rates. During deep burial, chemical systems close and diagenesis is primarily by pressure solution and quartz overgrowths (Wilson and Stanton, 1994).
Galloway (1984) lists three types of flow of water in a basin:
-
Meteoric flow--water infiltrates shallow portions of a basin from precipitation or surface waters. Deeper infiltration occurs from (a) eustatic sea level changes and/or (b) tectonic elevation of basin margins.
-
Compactional flow--compaction expels water upward and outward from the pores of sediments.
-
Thermobaric flow--water moves in response to pressure gradients caused by generation of hydrocarbons, release of mineral-bound water, and/or increased heat flow.
Figure 3 shows the water movement processes mentioned above.
Pore-Water Chemistry
Depositional
environment and climate control initial pore-water chemistry of a ![]() sandstone
sandstone![]() .
When the rock is buried below the level of meteoric groundwater influence,
pore-water chemistry changes as a result of two things:
.
When the rock is buried below the level of meteoric groundwater influence,
pore-water chemistry changes as a result of two things:
-
Increasing mineral solubility due to increasing temperatures.
-
Acidic fluids released by maturing organic-rich shales or organic matter in
 sandstone
 .
Acidic pore water leaches carbonate cement and grains.
.
Acidic pore water leaches carbonate cement and grains.
Eh-pH Graph
Figure 4 is an Eh-pH diagram, showing the approximate distribution of various types of subsurface fluids.
Pore-water Chemistry and Cements
Table 3 lists
common ![]() sandstone
sandstone![]() cements and the water chemistry associated with precipitation.
cements and the water chemistry associated with precipitation.
Subsurface Dissolved Solids
Figure 5 shows the general trend of increasing dissolved solids in subsurface fluids with increasing depth.
Influence of
Depositional Environment on ![]() Sandstone
Sandstone![]() Diagenesis
Diagenesis
Depositional
environment influences many aspects of ![]() sandstone
sandstone![]() diagenesis. The flow chart (Figure
6) shows the interrelationship of depositional environment with the many
factors controlling
diagenesis. The flow chart (Figure
6) shows the interrelationship of depositional environment with the many
factors controlling ![]() sandstone
sandstone![]() diagenesis.
diagenesis.
Sediment Texture and Composition
Depositional environment affects sediment composition by determining the amount of reworking and sorting by size or hydraulic equivalence. Sediments that have a higher degree of reworking are more mechanically and chemically stable. The energy level of depositional environments affects sorting by size or hydraulic equivalence and consequently produces different detrital mineral suites (Stonecipher and May, 1992).
For example, different facies of the Wilcox Group along the Gulf Coast of Texas have different compositions that are independent of their source area (Stonecipher and May, 1992). Wilcox basal fluvial point bar sands are the coarsest and contain the highest proportion of nondisaggregated lithic fragments. Prodelta sands, deposited in a more distal setting, contain fine quartz, micas, and detrital clays that are products of disaggregation. Reworked sands, such as shoreline or tidal sands, are more quartzose.
Depositional Pore-Water Chemistry
Depositional
pore-water chemistry of a ![]() sandstone
sandstone![]() is a function of depositional environment.
Marine sediments typically have alkaline pore water. Nonmarine sediments have
pore water with a variety of chemistries. In nonmarine sediments deposited in
conditions that were warm and wet, the pore water is initially either acidic or
anoxic and has a high concentration of dissolved mineral species (Burley et al.,
1985).
is a function of depositional environment.
Marine sediments typically have alkaline pore water. Nonmarine sediments have
pore water with a variety of chemistries. In nonmarine sediments deposited in
conditions that were warm and wet, the pore water is initially either acidic or
anoxic and has a high concentration of dissolved mineral species (Burley et al.,
1985).
Marine Pore-Water Chemistry
Marine water is slightly alkaline. Little potential for chemical reaction exists between normal marine pore water and the common detrital minerals of sediments deposited in a marine environment. Therefore, diagenesis of marine sandstones results from a change in pore-water chemistry during burial or the reaction of less stable sediment with amorphous material (Burley et al., 1985).
Marine Diagenesis
The precipitation of cements in quartzarenites and subarkoses deposited in a marine environment tends to follow a predictable pattern beginning with clay authigenesis associated with quartz and feldspar overgrowths, followed by carbonate precipitation. Clay minerals form first because they precipitate more easily than quartz and feldspar overgrowths, which require more ordered crystal growth. Carbonate cement stops the further diagenesis of aluminosilicate minerals.
Figure 7 summarizes typical diagenetic pathways for marine sediments.
Nonmarine Pore-Water Chemistry and Cements
Nonmarine pore-water chemistry falls into two climatic categories: (1) warm and wet or (2) hot and dry. The chemistry of pore waters formed in warm and wet conditions is usually acidic or anoxic with large concentrations of dissolved mineral species. The interaction of organic material with pore water is a critical factor with these waters. The depositional pore water of sediments deposited in hot and dry conditions is typically slightly alkaline and dilute.
Figure 8 shows typical diagenetic pathways for warm and wet nonmarine sediments.
Cements
Table 4, compiled from data by Thomas (1983), shows the cements that generally characterize specific depositional environments.
Diagenesis and Depositional Pore Waters
In the Wilcox of the Texas Gulf Coast, certain minerals precipitate as a result of the influence of depositional pore-water chemistry (Stonecipher and May, 1990):
-
Mica-derived kaolinite characterizes fluvial/distributary-channel sands flushed by fresh water.
-
Abundant siderite characterizes splay sands and lake sediments deposited in fresh, anoxic water.
-
Chlorite rims characterize marine sands flushed by saline pore water.
-
Glauconite or pyrite characterizes marine sediments deposited in reducing or mildly reducing conditions.
-
Illite characterizes shoreline sands deposited in the mixing zone where brackish water forms.
-
Chamosite characterizes distributary-mouth-bar sands rapidly deposited in the freshwater-marine water mixing zone.
![]() Predicting
Predicting![]()
![]() Sandstone
Sandstone![]()
![]() Reservoir
Reservoir![]()
![]() Porosity
Porosity![]()
We might have the
impression that abundant data and powerful computer models are necessary for
![]() porosity
porosity![]() prediction. They help. But even with sparse data, by using a little
imagination we can predict ranges of
prediction. They help. But even with sparse data, by using a little
imagination we can predict ranges of ![]() porosity
porosity![]() . This section presents different
methods of
. This section presents different
methods of ![]() predicting
predicting![]()
![]() sandstone
sandstone![]()
![]() porosity
porosity![]() . Choose the method(s) most appropriate
to your situation.
. Choose the method(s) most appropriate
to your situation.
A pitfall of
using ![]() porosity
porosity![]() -depth plots for
-depth plots for ![]() porosity
porosity![]() prediction is that regression
relationship averages out anomalies and complicates predictions of unusually
porous sandstones. Use
prediction is that regression
relationship averages out anomalies and complicates predictions of unusually
porous sandstones. Use ![]() porosity
porosity![]() -depth plots for
-depth plots for ![]() porosity
porosity![]() prediction with
caution. If enough
prediction with
caution. If enough ![]() porosity
porosity![]() data are available to make a meaningful plot, keep
the "data cloud" on the plot in order to view the ranges of
data are available to make a meaningful plot, keep
the "data cloud" on the plot in order to view the ranges of ![]() porosity
porosity![]() at
different depths. In a frontier exploration setting, the usefulness of
at
different depths. In a frontier exploration setting, the usefulness of
![]() porosity
porosity![]() -depth plots may be limited if global data sets must be used.
-depth plots may be limited if global data sets must be used.
Figure 9 presents
an example of regression ![]() porosity
porosity![]() -depth plots for different formations in U.S.
Gulf Coast region. Unfortunately it does not include the raw data, so we cannot
see
-depth plots for different formations in U.S.
Gulf Coast region. Unfortunately it does not include the raw data, so we cannot
see ![]() porosity
porosity![]() variations within each formation. Formations on the left side of
the plot, like the Vicksburg, tend to be quartz cemented. Formations on the
right side, like the Frio (areas 4-6), tend to be clay cemented.
variations within each formation. Formations on the left side of
the plot, like the Vicksburg, tend to be quartz cemented. Formations on the
right side, like the Frio (areas 4-6), tend to be clay cemented.
Equation
for ![]() Porosity
Porosity![]() Prediction
Prediction
Scherer (1987)
studied the cores of 428 worldwide sandstones and listed the most important
variables for ![]() predicting
predicting![]()
![]() sandstone
sandstone![]()
![]() porosity
porosity![]() :
:
-
Percentage of quartz grains
-
Sorting
-
Depth of burial
-
Age
Using regression analysis, he developed the following equation:
![]() Porosity
Porosity![]() = 18.60
+ (4.73 x in quartz) + (17.37/sorting) - (3.8 x depth x
10-3) - (4.65 x in age)
= 18.60
+ (4.73 x in quartz) + (17.37/sorting) - (3.8 x depth x
10-3) - (4.65 x in age)
where:
![]() Porosity
Porosity![]() = percent of bulk volume
= percent of bulk volume
In quartz = percent of solid-rock volume
Sorting = Trask sorting coefficient
Depth = meters
In age = millions of years
The equation can
be used with a high degree of confidence in uncemented to partly cemented
sandstones. But if the reduction of ![]() porosity
porosity![]() by cement exceeds 2.1% bulk volume,
then corrections need to be made based on local
by cement exceeds 2.1% bulk volume,
then corrections need to be made based on local ![]() sandstone
sandstone![]() quality
characteristics. Numbers for percent solid volume quartz and sorting may be
difficult to obtain. Use 75% for percent solid volume quartz and 1.5 for sorting
when these values are not known.
quality
characteristics. Numbers for percent solid volume quartz and sorting may be
difficult to obtain. Use 75% for percent solid volume quartz and 1.5 for sorting
when these values are not known.
Table 5 shows
numbers that Scherer (1987) developed by his analysis of ![]() reservoir
reservoir![]() sandstones.
sandstones.
![]() Predicting
Predicting![]() Effects of Diagenesis on
Effects of Diagenesis on ![]() Porosity
Porosity![]()
![]() Sandstone
Sandstone![]()
![]() porosity
porosity![]() prediction is a matter of estimating original composition and
subsequent diagenesis. Use the steps and action presented below to predict
prediction is a matter of estimating original composition and
subsequent diagenesis. Use the steps and action presented below to predict
![]() sandstone
sandstone![]()
![]() porosity
porosity![]() .
.
Step / Action
-
Estimate the original composition of the
sandstone from
provenance (use Figure 10) and depositional environment. -
Estimate the effects of near-surface diagenetic processes (see Figure 11).
-
Estimate the effects of mechanical diagenetic processes (see Figure 12).
-
Estimate the effects of intermediate and deep burial diagenesis, especially with respect to the creation of secondary
porosity. -
Using information collected in steps 1 through 4, predict the final
porosity ranges using burial history (next procedure).
![]() Predicting
Predicting![]() Effect of Provenance on Diagenesis
Effect of Provenance on Diagenesis
Use Figure 10 to predict the effect of original sediment composition on subsequent diagenesis.
Estimating Effect of Near-Surface Diagenesis
Use Figure 11 to estimate the effects of near-surface diagenesis (depth to point where temperature reaches 80oC).
![]() Predicting
Predicting![]() Effect of Mechanical Diagenesis
Effect of Mechanical Diagenesis
Use Figure 12 to
predict the effects of mechanical diagenesis on ![]() sandstone
sandstone![]()
![]() porosity
porosity![]() .
.
Using Burial History to Predict ![]() Porosity
Porosity![]()
Reconstructing
burial history aids ![]() sandstone
sandstone![]()
![]() porosity
porosity![]() prediction. A burial history diagram
integrates tectonic and hydrologic history with diagenetic evolution to predict
prediction. A burial history diagram
integrates tectonic and hydrologic history with diagenetic evolution to predict
![]() sandstone
sandstone![]()
![]() porosity
porosity![]() . The steps, with recommended action, given below for
. The steps, with recommended action, given below for
![]() predicting
predicting![]()
![]() porosity
porosity![]() from burial history and are illustrated in Figure
13.
from burial history and are illustrated in Figure
13.
Step / Action
-
Construct a burial history diagram for the formation of interest in the prospect area.
-
Plot the tectonic history of the basin in the prospect area along the lower x-axis.
-
Plot the hydrologic history of the prospect area along the lower x-axis. Use the tectonic history to infer the hydrologic history of the prospect.
-
Plot the
porosity curve by combining concepts of diagenetic processes
with
burial and hydrologic histories of the prospect.
Example of Using Burial History
Figure 13 is an example of a diagram showing diagenetic and burial history for the Brent Group sandstones, North Sea. Line thicknesses indicate relative abundance of diagenetic components.
Figure 14 is an
example of ![]() sandstone
sandstone![]()
![]() porosity
porosity![]() prediction using burial history.
prediction using burial history.
Analog
![]() porosity
porosity![]() values for different depositional environments can help us predict the
values for different depositional environments can help us predict the
![]() porosity
porosity![]() of
of ![]() reservoir
reservoir![]() system rocks when the target formation is unsampled within
the basin. Analog values, however, may have wide ranges within facies and
subfacies of depositional environments. Therefore, we should use care when
applying analog data.
system rocks when the target formation is unsampled within
the basin. Analog values, however, may have wide ranges within facies and
subfacies of depositional environments. Therefore, we should use care when
applying analog data.
![]() Predicting
Predicting![]()
![]() Sandstone
Sandstone![]() Permeability from Texture
Permeability from Texture
Pore type, pore
geometry, and fluid properties are critical factors affecting permeability.
![]() Sandstone
Sandstone![]() texture directly affects pore type and geometry. Knowing what textures
and fluids to expect, as well as what authigenic clays might be present, can
help us predict permeability.
texture directly affects pore type and geometry. Knowing what textures
and fluids to expect, as well as what authigenic clays might be present, can
help us predict permeability.
Effects of Pore Type and Geometry
Pore type, defined by pore throat size (i.e., macroporosity), directly controls rock permeability. Pore throat size limits flow capacity. Pore geometry also affects permeability, but not as much. The rougher the surface of the pore, the more difficult for fluid to flow through the pore and the lower the permeability.
Effects of Texture
![]() Sandstone
Sandstone![]() texture
affects permeability as follows:
texture
affects permeability as follows:
-
Decreasing grain size decreases permeability.
-
Increasing grain sorting increases permeability.
-
Increasing grain rounding increases permeability.
Figure 15 shows
how grain size affects permeability and ![]() porosity
porosity![]() .
.
Rules of Thumb for Gas vs. Oil
Use the following rules of thumb for permeability for oil vs. gas reservoirs:
-
At >10 md, the
reservoir can produce oil without stimulation. -
At >1 md, the
reservoir can produce gas without stimulation. -
At 1-10 md, the
reservoir probably requires stimulation for oil
production.
Effect of Authigenic Clays
Pore-bridging
clays, like illite, decrease ![]() porosity
porosity![]() slightly but can destroy
slightly but can destroy ![]() sandstone
sandstone![]() permeability. Discrete particle clay, like kaolinite, lowers
permeability. Discrete particle clay, like kaolinite, lowers ![]() porosity
porosity![]() and
permeability only slightly. Figure 16 compares
and
permeability only slightly. Figure 16 compares ![]() porosity
porosity![]() -permeability
relationships for kaolinite-, chlorite-, and illite-cemented sandstones. Note
there is no significant change in porosities, but permeabilities range over four
orders of magnitude.
-permeability
relationships for kaolinite-, chlorite-, and illite-cemented sandstones. Note
there is no significant change in porosities, but permeabilities range over four
orders of magnitude.
Pore Geometry and Clay Minerals
Figure 17 shows
pore lining and discrete particle clays that decrease ![]() porosity
porosity![]() and permeability
only slightly in contrast to pore-bridging clays, which decrease
and permeability
only slightly in contrast to pore-bridging clays, which decrease ![]() porosity
porosity![]() slightly but substantially lower permeability.
slightly but substantially lower permeability.
Detrital Clay and Permeability
Detrital clays
can be part of ![]() sandstone
sandstone![]() matrix or grains. As matrix, detrital clays can
obliterate permeability. Detrital grains of clay are often ductile and can be
compacted into pore spaces during burial. The percentage of detrital clay in a
rock determines permeability. Figure 18 shows different types of detrital clays
in a
matrix or grains. As matrix, detrital clays can
obliterate permeability. Detrital grains of clay are often ductile and can be
compacted into pore spaces during burial. The percentage of detrital clay in a
rock determines permeability. Figure 18 shows different types of detrital clays
in a ![]() sandstone
sandstone![]() .
.
Effect of Quartz Overgrowths
In general, as
quartz cement precipitates, the pore-pore throat size ratio approaches 1 (Hartmann
et al., 1985). Throats are reduced less than pore space; therefore, permeability
is affected less than ![]() porosity
porosity![]() . During cementation, the size of the pore spaces
between the pore-filling crystals decreases until it approaches the size of the
pore throats. Throats become more tabular or sheet-like.
. During cementation, the size of the pore spaces
between the pore-filling crystals decreases until it approaches the size of the
pore throats. Throats become more tabular or sheet-like. ![]() Sandstone
Sandstone![]()
![]() porosity
porosity![]() may
be quite low (<5%) and still have some permeability (<10 md) where
cemented with quartz.
may
be quite low (<5%) and still have some permeability (<10 md) where
cemented with quartz.
Effect of Fractures
Fractures enhance
the permeability of any ![]() sandstone
sandstone![]()
![]() reservoir
reservoir![]() . Fractures are especially important
for improving the permeability of
. Fractures are especially important
for improving the permeability of ![]() sandstone
sandstone![]() reservoirs with abundant
microporosity or disconnected dissolution
reservoirs with abundant
microporosity or disconnected dissolution ![]() porosity
porosity![]() .
.
![]() Predicting
Predicting![]() from Texture and Clay Content
from Texture and Clay Content
![]() Predicting
Predicting![]()
![]() sandstone
sandstone![]()
![]() reservoir
reservoir![]() permeability is possible as long as we realize that
potential errors may be large. Any process that decreases pore throat size
decreases permeability, so predict accordingly. Use steps, with recommended
action below, to help predict
permeability is possible as long as we realize that
potential errors may be large. Any process that decreases pore throat size
decreases permeability, so predict accordingly. Use steps, with recommended
action below, to help predict ![]() sandstone
sandstone![]()
![]() reservoir
reservoir![]() permeability.
permeability.
Step / Action
-
Estimate grain size, sorting, and
porosity using the depositional
environment.
For example, if a reservoir is a beach sand, it should be fine- to
medium-grained and well sorted with well-rounded quartz grains. -
Apply information from Step 1 to the
porosity-permeability-grain size
plot (Figure
15). Use porosity and
grain size from sandstone to estimate the permeability on the chart. -
If the
sandstone is poorly sorted or is cemented, then discount
permeability downward. -
Determine if authigenic clay is present. If so, what kind: pore lining, discrete particle, or pore throat bridging? Adjust permeability downward according to clay type present.
-
Determine if detrital clay is present using depositional environment (i.e., high energy = low clay content). If detrital clay is likely, then expect permeability to be low.
Estimating
![]() Sandstone
Sandstone![]() Permeability from Cuttings
Permeability from Cuttings
Sneider and King (1984) developed a cuttings-based method of permeability estimation. Where cuttings are available, permeability estimates can be made by examining the surfaces of cuttings for petrophysical permeability indicators. Estimates of the permeability for a particular formation can be extended into areas without data in order to predict permeability.
Basis
Sneider and
others at Shell Oil Company developed a methodology for estimating permeability
from cuttings by calibrating permeability measured from cores with rock-pore
parameters described in cuttings. Cores of known permeability were ground up
until chips from the core were the size of cuttings. By using comparators made
from core chips, they estimated formation permeability from cuttings with
surprising accuracy. Although Sneider and King (1984) describe the method for
estimating ![]() sandstone
sandstone![]() permeability from cuttings (presented below), procedures
could just as easily be developed to predict permeability of carbonates from
cuttings.
permeability from cuttings (presented below), procedures
could just as easily be developed to predict permeability of carbonates from
cuttings.
Petrophysical Description
From examination
of cuttings, ![]() sandstone
sandstone![]() permeability can be predicted using the following
petrophysical descriptions:
permeability can be predicted using the following
petrophysical descriptions:
-
Grain size and sorting
-
Degree of rock consolidation
-
Volume percent of clays
-
Pore sizes and pore interconnections
-
Size and distribution of pore throats
Sneider’s Pore Classification for Clastics
Sneider and King (1984) developed a simple method of classifying pore types from cuttings. The classification of clastic rock pore types from cuttings is made by comparing pore types with production tests and log analysis. The pore types are as follows:
Type / Description
-
Rocks with pores capable of producing gas without natural or artificial fracturing.
-
Rocks with pores capable of producing gas with natural or artificial fracturing and/or interbedded with type I rocks.
-
Rocks too tight to produce at commercial rates even with natural or artificial fracturing.
Table 6 lists the characteristics of pore types I, II, and III.
Examples of Pore Type I
The SEM photographs in Figure 19 are examples of rocks with types IA, IB, IC, and ID. Note the amount and connectivity of pore space of each subclass.
Pore Types II and III
The SEM photographs in Figure 20 are examples of rocks with types II and III. Note the amount and connectivity of pore space of each subclass.
Procedure: ![]() Predicting
Predicting![]()
![]() Sandstone
Sandstone![]() Permeability
Permeability
The procedure
below, with steps and recommended action, is for ![]() predicting
predicting![]() the permeability of
sandstones from cuttings using 20x magnification (from Sneider and King, 1984).
the permeability of
sandstones from cuttings using 20x magnification (from Sneider and King, 1984).
Step / Action
-
Estimate grain size and sorting using standard size-sorting comparators, thin section and SEM photomicrographs, and rock photographs.
-
Estimate volume percentages using Terry-Chillingar charts made for volume estimates.
-
Estimate consolidation using the scheme described in the preceding table.
-
Describe the visible and pinpoint
porosity and interconnectedness. -
Estimate permeability from rocks on comparators and/or using rock characteristics described in the preceding table. (Comparators can be made or purchased.)
-
Predict permeability for the formation in prospective areas where petrophysical characteristics are believed to be similar
Example of Petrophysical Evaluation: Evaluation of Saturation Profiles
General Statement
This section shows how saturation profiles can be used to understand the distribution of water saturations within a field or prospect.
The case study presented here is a summary of a larger study of the Sorrento field, southeast Colorado, by Hartmann and Coalson (1990). This study of cores and logs from four field wells shows how multiple oil-water contacts and apparent anomalies in saturation profiles in the Sorrento field were due to multiple flow units from two separate reservoirs. The study helps us understand shows and water saturations in wells outside Sorrento and therefore is useful for finding other traps in the same formation.
This section contains the following topics:
-
Setting and Structure of the Sorrento Field
-
Morrow Lithofacies and Pore Types
-
Sorrento Water Saturation Calculations
-
Petrophysical Analysis of Sorrento Field Wells
-
Water Saturation Profile for Sorrento Field
Setting and Structure of the Sorrento Field
Index Map
The Sorrento field is in southeastern Colorado on the north flank of the Las Animas Arch. The map (Figure 21) shows the location of the Sorrento field. Structure is contoured on the base of the Pennsylvanian.
Morrow Structure Map
The
Sorrento field ![]() reservoir
reservoir![]() is Pennsylvanian Morrow valley-fill sandstones. As
shown in Figure 22, structure contours on a marker bed above
the Morrow
is Pennsylvanian Morrow valley-fill sandstones. As
shown in Figure 22, structure contours on a marker bed above
the Morrow ![]() Sandstone
Sandstone![]() reflect the irregular thickness of the
reflect the irregular thickness of the ![]() sandstone
sandstone![]() body and a small structural nose and closure. The oil column is 70 ft (20 m) and
exceeds structural closure. This is a combination structural-stratigraphic trap.
Fluvial sandstones lap onto marine shale at the margins of the valley, forming
lateral seals.
body and a small structural nose and closure. The oil column is 70 ft (20 m) and
exceeds structural closure. This is a combination structural-stratigraphic trap.
Fluvial sandstones lap onto marine shale at the margins of the valley, forming
lateral seals.
In Figure 22, circled wells represent Marmaton wells; triangles, Mississippian wells; and large X’s, study wells. The rest of the oil wells produce from the Morrow. Each unit in the grid is 1 sq mi.
Morrow Lithofacies and Pore Types
By
studying core and log data from one well (well 11, see Figure
22), we see a
picture of a clastic ![]() reservoir
reservoir![]() with wide heterogeneity in total porosities,
pore-throat sizes, and capillary pressures. In addition, the depositional
environment of these sandstones (fluvial valley fill and
with wide heterogeneity in total porosities,
pore-throat sizes, and capillary pressures. In addition, the depositional
environment of these sandstones (fluvial valley fill and ![]() sandstone
sandstone![]() ) indicates
they probably have limited lateral continuity within the valley-fill complex.
) indicates
they probably have limited lateral continuity within the valley-fill complex.
![]() Reservoir
Reservoir![]() Lithologic Description
Lithologic Description
Morrow
sandstones in the Sorrento field are slightly shaly, range in grain size from
very coarse to fine, and are poorly sorted. As a consequence, pores and pore
throats also have wide ranges in size. Hand-sample petrography indicates the
dominant ![]() porosity
porosity![]() is intergranular micro- to megaporosity. Clay crystals create
minor intercrystalline microporosity in larger pores. Moldic (cement solution?)
is intergranular micro- to megaporosity. Clay crystals create
minor intercrystalline microporosity in larger pores. Moldic (cement solution?)
![]() porosity
porosity![]() also may be present but is minor.
also may be present but is minor.
![]() Reservoir
Reservoir![]()
![]() Porosity
Porosity![]() and Permeability
and Permeability
Morrow
sandstones in Sorrento field have a wide range in ![]() porosity
porosity![]() and permeability.
Maximum observed
and permeability.
Maximum observed ![]() porosity
porosity![]() (F) is 20-22%,
but more typical values are 10-15%. Air permeabilities (Ka) are as
great as 1-2 darcies but more commonly are 200-500 md.
(F) is 20-22%,
but more typical values are 10-15%. Air permeabilities (Ka) are as
great as 1-2 darcies but more commonly are 200-500 md.
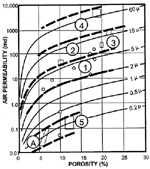
In a Ka/F crossplot for well 11 (Figure 23), dots and polygons represent measured Ka/F values. Curves are the graphical solution of Winland’s r35 equation (Pittman, 1992) and represent equal r35 values (port size).
The crossplot shows a large variation in port size for the samples from well 11. Areas between dashed lines group points into beds with similar port size, or flow units.
Extrapolated Capillary Pressure Curves and Pore Types
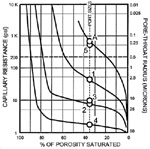
No capillary pressure measurements were available for this study. They were estimated y plotting r35 values on a semilog crossplot of fluid saturation vs. capillary pressure. A capillary pressure curve for each sample passes through its correlative r35 value. Calculations of r35 for well 11 indicate a large variety of capillary pressures and pore types. Pore types for the Morrow samples from this well are mega, macro, and micro.
The numbers on the curves in Figure 24 correspond to the numbers on the Ka/F crossplot on Figure 22. Minimum water saturations (“immobile” water) estimated from log calculations let us extrapolate the Pc curves into low Sw ranges.
Sorrento Water Saturation Calculations
Method
Density
logs were the primary source of ![]() porosity
porosity![]() values. Matrix density appears to be
about 2.68 g/cc, based on core-measured grain densities (consistent with the
presumed mineralogy of the sandstones). Crossplot porosities were not used to
avoid introducing a systematic error in these variably shaly sandstones (Patchett
and Coalson, 1982).
values. Matrix density appears to be
about 2.68 g/cc, based on core-measured grain densities (consistent with the
presumed mineralogy of the sandstones). Crossplot porosities were not used to
avoid introducing a systematic error in these variably shaly sandstones (Patchett
and Coalson, 1982).
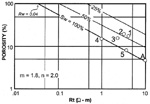
Pickett Plot
Formation-water resistivities and water saturations were estimated from Pickett plots. The inferred cementation exponent (m) is 1.8 because of the presence of clays, well-connected solution pores (e.g., James, 1989; Muller and Coalson, 1989), or pyrite (Krystinik, L., personal communication). Formation factors measured on core samples from well 1 support this interpretation.
The Pickett in Figure 25 shows data from well 11. The number labels represent the flow units from Figure 24.
Saturation Exponents, n
Saturation
exponents (n) measured on samples from well 1 showed variations that relate to
pore geometry. Microporous siltstones displayed n greater than 2, indicating
either very tortuous pore systems or incomplete saturation by brine during
testing. Saturation exponents were less than 2 in the best ![]() porosity
porosity![]() type. This
implies the
type. This
implies the ![]() reservoir
reservoir![]() is somewhat shaly. However, n was assumed equal to 2 for
log calculations because the lab data were not far from that value and because
lab measurements of saturation exponents are notoriously difficult.
is somewhat shaly. However, n was assumed equal to 2 for
log calculations because the lab data were not far from that value and because
lab measurements of saturation exponents are notoriously difficult.
Petrophysical Analysis of Sorrento Field Wells
Well 11 Flow Units
Flow
units were determined in well 11 by plotting and grouping routine core data. The
top and bottom of the Morrow (flow units A and 5) are microporous,
low-permeability sandstones that are wet but too tight to produce. Between these
are 30 ft (8.5 m) of meso- to macroporous ![]() sandstone
sandstone![]() (flow units 1-4).
(flow units 1-4).
All
pertinent petrophysical data for well 11 are summarized on Figure
26. ![]() Sandstone
Sandstone![]() descriptors found on
descriptors found on ![]() porosity
porosity![]() logs are as follows:
logs are as follows:
VF = very fine grained |
C = coarse grained |
SLTY = silty |
F = fine grained |
VC = very coarse grained |
SLT = siltstone |
M = medium grained |
SHY= shaly |
SH = shale |
Subsea elevation of -1,030 ft (-314 m) is marked in the depth track.
Well 11 Water Saturations
Flow unit 4 is macroporous but wet (Sw = 100%); this indicates an oil-water contact. Flow unit 3 is macroporous and has intermediate water saturation (Sw = 70%). This looks like a transition zone. Flow units 2 and 1 are mesoporous and are at immobile water saturation (Sw = 45%). This is verified by the well testing about 100 bo/d and 300 Mcfg/d (16 m3 oil and 8,500 m3 gas per day) with no water from perforations in these flow units and by a bulk-volume-water plot following. This lack of water production is remarkable, considering that the well lies only about 25 ft (7 m) above the free water level.
Figure 27 is the bulk-volume-water (Buckles) plot for well 11.
Well 4
Well
4 hit the Morrow near the top of the oil column. It had the lowest saturations
and best flow rates of all the wells studied, even though it had the thinnest
![]() reservoir
reservoir![]() . This is because it contained rock with large pore throats (r35
up to 50m) that was fully saturated with
oil (Sw = 25-30%). The well tested 230 bo/d and 387 Mcfg/d (37 m3
oil and 11,000 m3 gas per day). Initial production was 51 bo/d and
411 Mcfg/d (8 m3 oil and 12,000 m3 gas per day). The difference could
be due to a loss of
. This is because it contained rock with large pore throats (r35
up to 50m) that was fully saturated with
oil (Sw = 25-30%). The well tested 230 bo/d and 387 Mcfg/d (37 m3
oil and 11,000 m3 gas per day). Initial production was 51 bo/d and
411 Mcfg/d (8 m3 oil and 12,000 m3 gas per day). The difference could
be due to a loss of ![]() reservoir
reservoir![]() thickness near the well bore, judging from the
thinness of the
thickness near the well bore, judging from the
thinness of the ![]() reservoir
reservoir![]() .
.
Figure 28 summarizes the petrophysical characteristics of well 4.
Well 8
Wells
8 and 1 both are interpreted as encountering transition zones, based on ![]() porosity
porosity![]() types and log-calculated saturations. Well 8 encountered the Morrow just above
the water level. Pore throats are meso- to macroporous. The two upper flow units
probably are close to immobile water saturation. However, the two basal zones (3
and 4) have high saturations of mobile water. This explains why the well cut
water on initial potential testing. This water production should increase with
time as the water leg rises.
types and log-calculated saturations. Well 8 encountered the Morrow just above
the water level. Pore throats are meso- to macroporous. The two upper flow units
probably are close to immobile water saturation. However, the two basal zones (3
and 4) have high saturations of mobile water. This explains why the well cut
water on initial potential testing. This water production should increase with
time as the water leg rises.
Figure 29 summarizes the petrophysical characteristics of well 8.
Well 1
Well 1 (Figure 30) is similar to well 8, except that flow unit 2 of well 1 shows an anomalous low resistivity. The interval tested 32 bo/d and 15 Mcfg/d (5 m3 oil and 425 m3 gas per day) with no water. Therefore, the zone by definition is at immobile water saturation (Swi = 40%). The discrepancy suggests that the log resistivity was too low due to bed resolution problems. If true resistivity is 9 ohm-m2/m (used for the calculation), then the true water saturation is less than 40%.
Caveat
While
these petrophysical methods of analyzing wells are reliable and widely
applicable in water-wet reservoirs, there is at least one source of potential
error: the assumption that there are no lithologic changes that affect
log-calculation parameters without affecting permeability-![]() porosity
porosity![]() relationships. Examples include vuggy or fracture
relationships. Examples include vuggy or fracture ![]() porosity
porosity![]() and variable shale
effects. If such changes occur, then we must modify the relationships between
calculated saturations and producibility.
and variable shale
effects. If such changes occur, then we must modify the relationships between
calculated saturations and producibility.
Water Saturation Profile for Sorrento Field
General Statement
Morrow
![]() sandstone
sandstone![]() reservoirs reportedly display multiple oil-water contacts in several
fields in the area (Sonnenberg, personal communication). Reliably recognizing
separate reservoirs in a field requires considering capillary pressures, heights
above free water, and observed water saturations. One convenient way to do this
is to plot water saturation against structural elevation while differentiating
pore throat sizes.
reservoirs reportedly display multiple oil-water contacts in several
fields in the area (Sonnenberg, personal communication). Reliably recognizing
separate reservoirs in a field requires considering capillary pressures, heights
above free water, and observed water saturations. One convenient way to do this
is to plot water saturation against structural elevation while differentiating
pore throat sizes.
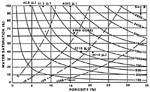
Sw-Elevation Plot
An Sw-elevation plot (Figure 31) for study wells 4, 8, and 11 defines a trend of decreasing water saturation with increasing height. Well 1 is not on the same trend. Differences in water saturation attributable to differences in capillary pressures are apparent but are not great enough to explain the discrepancy. Ignoring possible hydrodynamic effects, the difference in trends probably represents two separate oil columns and therefore two reservoirs.
Barwis,
J.H., J.G. McPherson, and J.R.J. Studlick, 1989,
![]() Sandstone
Sandstone![]() Petroleum Reservoirs: New York, Springer-Verlag, 583 p. Contains case
histories of fields with reservoirs that represent each of the major
depositional environments.
Petroleum Reservoirs: New York, Springer-Verlag, 583 p. Contains case
histories of fields with reservoirs that represent each of the major
depositional environments.
Beard,
D.C., and P.K. Weyl, 1973, Influence of texture on ![]() porosity
porosity![]() and permeability of
unconsolidated sand: AAPG Bulletin, vol. 57, no. 2, p. 349-369.
and permeability of
unconsolidated sand: AAPG Bulletin, vol. 57, no. 2, p. 349-369.
Burley, S.D., J.D. Kantorowicz, and B. Waugh, 1985, Clastic diagenesis, in P.J. Brenchley and B.P.J. Williams, eds., Sedimentology: Recent Developments and Applied Aspects: London, Blackwell Scientific Publications, p. 189-228.
Choquette,
P.W., and L.C. Pray, 1970, Geologic nomenclature and classification of ![]() porosity
porosity![]() in sedimentary carbonates: AAPG Bulletin, vol. 54, no. 2, p. 207-250. Classic
reference for basic concepts regarding carbonate
in sedimentary carbonates: AAPG Bulletin, vol. 54, no. 2, p. 207-250. Classic
reference for basic concepts regarding carbonate ![]() porosity
porosity![]() .
.
Coalson, E.B., D.J. Hartmann, and J.B. Thomas, 1990, Applied Petrophysics in Exploration and Exploitation: Notes from short course sponsored by Univ. of Colo.-Denver, var. pages.
Galloway,
W.E., 1984, Hydrogeologic regimes of ![]() sandstone
sandstone![]() diagenesis, in D.A. McDonald and
R.C. Surdam, eds., Clastic Diagenesis: AAPG Memoir 37, p. 3-14.
diagenesis, in D.A. McDonald and
R.C. Surdam, eds., Clastic Diagenesis: AAPG Memoir 37, p. 3-14.
Galloway,
W.E., and D.K. Hobday, 1983, Terrigenous Clastic Depositional Systems:
Applications to Petroleum, Coal, and Uranium Exploration: New York, Springer-Verlag,
438 p. Summarizes ![]() reservoir
reservoir![]() characteristics of major
characteristics of major ![]() sandstone
sandstone![]() depositional
environments, especially with respect to sand body geometries.
depositional
environments, especially with respect to sand body geometries.
Harrison, W.J., and R.N. Tempel, 1993, Diagenetic pathways in sedimentary basins, in A.D. Horbury and A.G. Robinson, eds., Diagenesis and Basin
Hartmann,
D.J., and E.B. Coalson, 1990, Evaluation of the Morrow ![]() sandstone
sandstone![]() in Sorrento
field, Cheyenne County, Colorado, in S.A. Sonnenberg, L.T. Shannon, K. Rader,
W.F. von Drehle, and G.W. Martin, eds., Morrow Sandstones of Southeast Colorado
and Adjacent Areas: RMAG Symposium, p. 91-100.
in Sorrento
field, Cheyenne County, Colorado, in S.A. Sonnenberg, L.T. Shannon, K. Rader,
W.F. von Drehle, and G.W. Martin, eds., Morrow Sandstones of Southeast Colorado
and Adjacent Areas: RMAG Symposium, p. 91-100.
Hayes,
J.B., 1983, ![]() Sandstone
Sandstone![]() diagenesis as an exploration tool: AAPG Clastic Diagenesis
School, June 27-July 1, Monterey, California.
diagenesis as an exploration tool: AAPG Clastic Diagenesis
School, June 27-July 1, Monterey, California.
James,
S.W., 1989, Diagenetic history and ![]() reservoir
reservoir![]() characteristics of a deep Minnelusa
characteristics of a deep Minnelusa
![]() reservoir
reservoir![]() , Hawk Point field, Powder River basin, Wyoming, in E.B. Coalson, S.S.
Kaplan, C.W. Keighin, C.A. Oglesby, and J.W. Robinson, eds., Petrogenesis and
Petrophysics of Selected
, Hawk Point field, Powder River basin, Wyoming, in E.B. Coalson, S.S.
Kaplan, C.W. Keighin, C.A. Oglesby, and J.W. Robinson, eds., Petrogenesis and
Petrophysics of Selected ![]() Sandstone
Sandstone![]() Reservoirs of the Rocky Mountain Region: RMAG
Symposium, p. 81-96.
Reservoirs of the Rocky Mountain Region: RMAG
Symposium, p. 81-96.
_____,
M.M. Dodge, and W.E. Galloway, 1984, Regional controls on diagenesis and
![]() reservoir
reservoir![]() quality in Lower Tertiary sandstones along the Texas Gulf Coast, in
quality in Lower Tertiary sandstones along the Texas Gulf Coast, in
Muller,
M.M., and E.B. Coalson, 1989, Diagenetic and petrophysical variations of the
Dakota ![]() sandstone
sandstone![]() , Henry field, Green River basin, Wyoming, in E.B. Coalson, S.S.
Kaplan, C.W. Keighin, C.A. Oglesby, and J.W. Robinson, eds., Petrogenesis and
Petrophysics of Selected
, Henry field, Green River basin, Wyoming, in E.B. Coalson, S.S.
Kaplan, C.W. Keighin, C.A. Oglesby, and J.W. Robinson, eds., Petrogenesis and
Petrophysics of Selected ![]() Sandstone
Sandstone![]() Reservoirs of the Rocky Mountain Region: RMAG
Symposium, p. 149-158.
Reservoirs of the Rocky Mountain Region: RMAG
Symposium, p. 149-158.
Neasham,
J.W., 1977, The morphology of dispersed clay in ![]() sandstone
sandstone![]() reservoirs and its
effect on
reservoirs and its
effect on ![]() sandstone
sandstone![]() shaliness, pore space, and fluid flow properties:
Proceedings of the SPE Annual Meeting, October 9-12, paper SPE-6858.
shaliness, pore space, and fluid flow properties:
Proceedings of the SPE Annual Meeting, October 9-12, paper SPE-6858.
North, F.K., 1985, Petroleum Geology: London, Allen & Unwin, 607 p.
Patchett,
J.G., and E.B. Coalson, 1982, The determination of ![]() porosity
porosity![]() in
in ![]() sandstone
sandstone![]() and
shaly
and
shaly ![]() sandstone
sandstone![]() , part 2: effects of complex mineralogy and hydrocarbons: 23rd
Annual SPWLA Logging Symposium, July 6-9, paper T, 50 p.
, part 2: effects of complex mineralogy and hydrocarbons: 23rd
Annual SPWLA Logging Symposium, July 6-9, paper T, 50 p.
Pittman,
E.D., 1992, Relationship of ![]() porosity
porosity![]() to permeability to various parameters
derived from mercury injection-capillary pressure curves for
to permeability to various parameters
derived from mercury injection-capillary pressure curves for ![]() sandstone
sandstone![]() : AAPG
Bulletin, vol. 76, no. 2, p. 191-198.
: AAPG
Bulletin, vol. 76, no. 2, p. 191-198.
Scherer,
M., 1987, Parameters influencing ![]() porosity
porosity![]() in sandstones: a model for
in sandstones: a model for ![]() sandstone
sandstone![]()
![]() porosity
porosity![]() prediction: AAPG Bulletin, vol. 71, no. 5, p. 485-491.
prediction: AAPG Bulletin, vol. 71, no. 5, p. 485-491.
Shelley, R.C., 1985, Elements of Petroleum Geology: San Francisco, W.H. Freeman, 449 p.
Sneider,
R.M., and H.R. King, 1984, Integrated rock-log calibration in the Elmworth
field, Alberta, Canada: part I: ![]() reservoir
reservoir![]() rock detection and characterization,
in J.A. Masters, ed., Elmworth--Case Study of a Deep Basin Gas Field: AAPG
Memoir 38, p. 205-214.
rock detection and characterization,
in J.A. Masters, ed., Elmworth--Case Study of a Deep Basin Gas Field: AAPG
Memoir 38, p. 205-214.
Sonnenberg,
S.A., 1985, Tectonic and sedimentation model for Morrow ![]() sandstone
sandstone![]() deposition,
Sorrento field area, Denver basin, Colorado: The Mountain Geologist, October, p.
180-191.
deposition,
Sorrento field area, Denver basin, Colorado: The Mountain Geologist, October, p.
180-191.
Stonecipher,
S.A., and J.A. May, 1990, Facies controls on early diagenesis: Wilcox Group,
Texas Gulf Coast, in D. Meshri and P.J. Ortoleva, eds., Prediction of ![]() Reservoir
Reservoir![]() Quality Through Chemical Modeling, I: AAPG Memoir 49, p. 25-44.
Quality Through Chemical Modeling, I: AAPG Memoir 49, p. 25-44.
Stonecipher,
S.A., R.D. Winn, Jr., and M.G. Bishop, 1984, Diagenesis of the Frontier
Formation, Moxa Arch: a function of ![]() sandstone
sandstone![]() geometry, texture and composition,
and fluid flux, in D.A. McDonald and R.C. Surdam, eds., Clastic Diagenesis: AAPG
Memoir 37, p. 289-316.
geometry, texture and composition,
and fluid flux, in D.A. McDonald and R.C. Surdam, eds., Clastic Diagenesis: AAPG
Memoir 37, p. 289-316.
Surdam,
R.C., T.L. Dunn, D.B. MacGowan, and H.P. Heasler, 1989, Conceptual models for
the prediction of ![]() porosity
porosity![]() evolution with an example from the Frontier
evolution with an example from the Frontier
![]() Sandstone
Sandstone![]() , Big-horn basin, Wyoming, in E.B. Coalson, S.S. Kaplan, C.W. Keighin,
L.A. Oglesby, and J.W. Robinson, eds.,
, Big-horn basin, Wyoming, in E.B. Coalson, S.S. Kaplan, C.W. Keighin,
L.A. Oglesby, and J.W. Robinson, eds., ![]() Sandstone
Sandstone![]() Reservoirs: Rocky Mountain
Association of Geologists, p. 7-21.
Reservoirs: Rocky Mountain
Association of Geologists, p. 7-21.
Thomas, L.K., P.L. Katz, and M.R. Tek, 1968, Threshold pressure phenomena in porous media: SPE Journal, June, p. 174-184.
Wilson,
M.D., 1994a, Non-compositional controls on diagenetic processes, in M.D. Wilson,
ed., ![]() Reservoir
Reservoir![]() Quality Assessment and Prediction in Clastic Rocks: SEPM Short
Course 30, p. 183-208. Discusses the effect that variables such as temperature
and pressure have on diagenesis of sandstones. A good reference for
Quality Assessment and Prediction in Clastic Rocks: SEPM Short
Course 30, p. 183-208. Discusses the effect that variables such as temperature
and pressure have on diagenesis of sandstones. A good reference for ![]() predicting
predicting![]()
![]() sandstone
sandstone![]()
![]() reservoir
reservoir![]() system quality.
system quality.
_____,
1994b, Assessing the relative importance of diagenetic processes and controls,
in M.D. Wilson, ed., ![]() Reservoir
Reservoir![]() Quality Assessment and Prediction in Clastic
Rocks: SEPM Short Course 30, p. 259-276.
Quality Assessment and Prediction in Clastic
Rocks: SEPM Short Course 30, p. 259-276.
_____ and E.D. Pittman, 1977, Authigenic clays in
sandstones: recognition and influence on ![]() reservoir
reservoir![]() properties and
paleoenvironmental analysis: Journal of Sedimentary Petrology, vol. 47, no. 1,
p. 3-31.
properties and
paleoenvironmental analysis: Journal of Sedimentary Petrology, vol. 47, no. 1,
p. 3-31.