![]() Click to view page images in PDF format.
Click to view page images in PDF format.
Conducting a Field Study with GIS: Port Hudson Field, Tuscaloosa Trend, East Baton Rouge Parish, Louisiana*
Kirk A. Barrell, Geodynamic Solutions, Inc. Houston, Texas, U. S. A.
Search and Discovery Article #40007 (2000)
*Adapted and revised slightly for online presentation from an article of the same title by the author in Geographic information systems in petroleum exploration and development, T. C. Coburn and J. M. Yarus, eds: AAPG Computer Applications in Geology, No. 4, 315 p., which is now available for purchase from AAPG Bookstore.
Abstract
A multi-discipline team was assembled to reevaluate Amoco (now BP/Amoco) Production Company's Tuscaloosa producing assets. Port Hudson field, the largest field in the trend, was targeted for a reservoir evaluation. A geographic information system (GIS) was designed and implemented to manage, analyze, and present spatial and tabular datasets for the project. Geographic datasets covering the entire Tuscaloosa trend were digitized and input into a centralized database. The GIS was used to integrate multiple disciplines, databases, and software applications. The software technology that was employed by the team included geophysical interpretation, log analysis, and spreadsheet programs. The GIS was designed to be the tool for integrating, accessing, and analyzing data spatially. The GIS approach presented an entirely new, unique, and efficient business process. This paper represents a case study of using GIS technology to perform an exploitation field study.
List of Figures

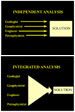
 Figure 3-Multi-discipline team integration through the use of geographic information systems (GIS).
 Figure 4-System architecture and tools for a geographic information system (GIS).
 Figure 5-Field study mapping process.
 Figure 6-Structure map on the B2 reservoir unit.
Click here for animation of maps from figures 6, 7, 8, 9, and 10.
 Figure 7-Net effective sand map on the B2 reservoir unit.
Click here for animation of maps from figures 6, 7, 8, 9, and 10.
 Figure 8-Average porosity map on the B reservoir units.
Click here for animation of maps from figures 6, 7, 8, 9, and 10.
 Figure 9-Average water saturation map on the B2 reservoir unit.
Click here for animation of maps from figures 6, 7, 8, 9, and 10.
 Figure 10-Net pay map on the A8 reservoir unit.
Click here for animation of maps from figures 6, 7, 8, 9, and 10.
Multi-Discipline Team Approach
Geophysical Evaluation Process
Petrophysical Evaluation Process
Reservoir Engineering Evaluation Process
Port Hudson field is located in east Baton Rouge Parish, Louisiana (Figure 1). Amoco Production Company (now BP/Amoco) discovered Port Hudson field in 1977. The field produces from the Upper Cretaceous Tuscaloosa Formation and, to date, has produced over 500 billion ft3 of gas. The field is a complex faulted anticline occurring over a piercement salt dome.
A multi-discipline team was assembled to reevaluate Amoco Production Company's Tuscaloosa producing assets. Port Hudson field, the largest field in the trend, was targeted for a reservoir evaluation. The objective of the project was two-fold:
• Define the original and remaining hydrocarbons in the field; and,
• Create and implement a plan to recover the remaining reserves.
It was determined that the latest state-of-the-art technology would be employed to achieve the project objectives. A 3D seismic survey was acquired over the field to image this complex structure.
Geographic information systems (GIS) is a rapidly emerging technology that enables the spatial analysis of datasets. Once the geographic relationships of data are determined, many types of analysis can be performed on individual or multiple map (data) layers. The maps from the GIS are a representation of one or more map layers displayed on top of one another. Layer-to-layer queries and iterative and dynamic evaluations are possible. Symbology is the ability to use color, size, thickness, or style to represent an attribute of the features from the map layer. Using digital data greatly improves the accuracy of the map. GIS technology can greatly improve the integration of people, data, and software. Recent decreases in cost and complexity have made GIS more accessible to a much larger user base.
Multi-Discipline Team Approach
In 1991, at the onset of the Port Hudson field evaluation, Amoco Production Company was evaluating business processes across the corporation. During this time, the multi-discipline team approach for reservoir evaluation was considered.
Geologists, geophysicists, engineers, and petrophysicists usually perform exploitation evaluation. Historically, petroleum exploitation has been conducted through independent analysis of multiple individuals from different disciplines (Figure 2A). Following the reservoir analysis process, the individuals come together to integrate the independent evaluations into a final solution. As illustrated in Figure 2B, the recent trend in the industry is to form multi-discipline teams and approach the analysis using an integrated approach (Sneider, 1986).
A multi-discipline team was assembled to perform the Port Hudson field reservoir evaluation. The team consisted of a geologist, a geophysicist, a reservoir engineer, and a petrophysicist. The GIS was used to integrate multiple disciplines, databases, and software applications (Figure 3).
One of the goals of implementing the GIS was to integrate existing software applications. The software technology that was employed by the team included geophysical interpretation, log analysis, and spreadsheet programs. The GIS was designed to be the tool for integrating, accessing, and analyzing data spatially (Figure 4). All geophysical software resided on a UNIX workstation, whereas the log analysis and spreadsheet software resided on a personal computer operating under Microsoft Windows. The 3-D seismic survey was interpreted on the geophysical workstation, and map layers were exported into the GIS. Geophysical map layers included top-of-sand structure contours, top-of-sand faults, and sand isochron contours. Log analysis was performed by the petrophysicist, and calculated results were imported into the GIS as database tables. These tables were relationally joined to the well map layers, which enabled the log calculations to be presented and analyzed spatially on the map. Reservoir net pay contour areas were directly calculated by the GIS. These values were exported into a spreadsheet for reservoir volumetric calculations.
During the reservoir evaluation, a significant amount of geological research and analysis was performed prior to using the GIS. Conventional core measurements were evaluated to determine reservoir rock types. These rock types were combined with well log data to create a rock-to-log correlation. Well log cross-sections were then constructed and analyzed, which resulted in the definition of 16 individual reservoir units. Tops of the reservoir units in measured depth were entered into the GIS for mapping. The tops were also imported into the log analysis application to allow petrophysical calculations to be performed on each individual reservoir unit. Reservoir unit calculations were subsequently imported back into the GIS for mapping of multiple attributes on all 16 reservoir units. The result of the mapping exercise was the determination of original gas in place and remaining gas reserves for each individual reservoir unit.
Geophysical Evaluation Process
Using the geophysical workstation, synthetic seismograms were incorporated into the evaluation. Tops were imported from the GIS and merged into the synthetic seismograms. Fieldwide correlatable, continuous time reflectors were defined and mapped. Faults and stratigraphic features were also identified and mapped. Time structure and isochronal maps were generated on the definable time horizons. The time structure and isochronal maps were converted into depth and thickness. The structure and isopach maps were then exported to the GIS.
Petrophysical Evaluation Process
Rock types identified by the geologist were input into the petrophysical evaluation software. As noted, these data were combined with the well logs to determine a rock-to-log correlation index. The correlation index consisted of a probability tool that enabled the petrophysicist to predict rock types over intervals where conventional core was not available. Knowing rock types for each 1 ft interval in the well enabled the petrophysicist to apply different log parameters to each rock type for calculation. The result was a more accurate determination of the presence of hydrocarbons. Petrophysical values, such as average water saturation, net effective sand, and net pay were exported into the GIS for each of the reservoir units. For purposes of sensitivity analysis, a different set of values was calculated for each of the three different porosity values.
Reservoir Engineering Evaluation Process
Each well was evaluated to determine original and current water levels in the reservoirs. These values were input into the GIS for spatial analysis. Production analysis was performed to predict future hydrocarbon recoveries. Cumulative production was first assessed and assigned to each perforated interval and was then allocated to each reservoir unit. Following the mapping process in the GIS, net pay contour areas were exported into a spreadsheet. Reservoir volumes were then calculated from the net pay contour areas. These calculated volumes were compared with cumulative production volumes and originally calculated ultimate reserve recoveries. Numerous iterations were then performed on the map layers in the GIS to obtain reasonable net pay contour areas.
The various data sets were imported and integrated into the GIS. The goal of the mapping process was to determine the original and remaining hydrocarbon volumes in the field. This process consisted of generating six different maps on each of the 16 reservoir units (Figure 5). Numerous iterations were performed on the maps as new data were generated and imported from the 3-D seismic and petrophysical data sets.
In the GIS, subsea top values were calculated from the tops of the reservoir unit given in measured depth. From these values, reservoir structure maps were created on each unit (Figure 6). Because the 3-D seismic could not resolve down to the reservoir unit level, the top-of-structure maps from the 3-D seismic survey were integrated to serve as a guideline and to ensure accuracy. From the petrophysical data, gross reservoir unit isopach maps were generated. These maps illustrated the orientation of, and variance in, thickness of the sand body.
Net effective sand maps, representing the feet of effective reservoir rock, were then generated to display the spatial variance in reservoir thickness (Figure 7). These maps present the amount of potential reservoir rock across the field. Using the filtering capability of the GIS, net effective sand maps were generated for the three different porosity values. This exercise enabled the team to assess the change in reservoir thickness as affected by different porosity. Average porosity of the reservoir unit was then generated to determine the spatial variance in porosity across the structure (Figure 8). Average water saturation maps were also generated to determine the original and current water levels in the water-drive reservoirs (Figure 9).
The final and most important map generated was the net pay map (Figure 10). The numbers on the map represent the net pay value for each contour. The net pay map was created dynamically in the GIS by overlaying the top-of-reservoir structure, base-of-reservoir structure, and the net effective sand map. These contour maps were also integrated with the fault locations from the 3-D seismic to ensure accurate delineation of the reservoirs. Net pay contours were defined and constructed as polygonal map features that enabled the GIS to automatically calculate the area under each individual contour. These area values were imported into the reservoir engineer's spreadsheet, where the reservoir volume was calculated. Calculated reservoir volumes were then compared to the production analysis and the original calculated ultimate reservoir hydrocarbon recovery. Individual maps were re-examined in cases where the calculated volume did not align with cumulative production or current reservoir water levels.
The GIS database consisted of two types of data: map layers and tabular databases. In the GIS, map layers are dynamically linked to tabular data tables. This link allowed for the posting and spatial analysis of any attribute in the tabular databases.
Three types of spatial data can be stored in a GIS: points, lines, and polygons. Points are represented by a single pair of latitude and longitude values, or x-y coordinates. Examples of points are well locations. Two or more pairs of x-y coordinates are used to represent lines. An example of a line layer is a gas pipeline. Three or more pairs of x-y coordinates are used to represent polygons, the most complex data type, where the first and last pairs represent the same coordinates.
In this project, the map layers were grouped into four categories: well, reservoir, 3-D seismic, and culture. The well data were stored as three map layers: surface location, bottom hole location, and the directional wellbore path. The directional wellbore path represents the direction of the wellbore from the surface to the bottom hole location as projected onto the earth's surface. The reservoir map layers consisted of the following contour types: structure, gross sand, net effective sand, and net pay. The reservoir layers also included the original and current reservoir water levels. Polygonal layers included the sand depositional fairway and areas where erosion had occurred. The 3-D seismic layers included structure contours, isopach contours, and fault locations. The culture layers included section boundaries, township-range boundaries, unit boundaries, and the locations of surface gas plants and processing facilities.
The tabular databases included three types of data: well header, petrophysical, and reservoir unit tops. The well header table contained general information about the well, such as operator, lease, well number, total depth, spud date, and completion date. There were many petrophysical tables and attributes as a result of the calculated values for three different reservoir porosity values. The table containing tops of the reservoir units included both tops and bases for all 16 reservoirs, as well as associated gross isopach values that were calculated in the GIS.
The application of GIS technology to this reservoir evaluation project resulted in many substantial benefits. The use of GIS technology greatly enhanced the analysis process and significantly decreased the project cycle time. This reservoir evaluation, as all others, involved many iterations. Digital datasets integrated into a GIS enabled the team to perform numerous "what-if" analyses. Dynamic editing and updating of map layers resulted in rapid retrieval of new information. The ability to overlay several map layers automated the net pay map-generation process. Using digital data sets provided a more accurate method for generating reservoir maps. Automatic calculation of the net pay contour areas significantly reduced the time required to assess reservoir volumes. Finally, GIS enabled the team to share data and analyses, which resulted in an integrated interpretation. The ability of the GIS to integrate data from the geophysical and petrophysical applications provided a seamless mechanism for analyzing the entire data set and resulted in a more efficient business and project analysis process.
I wish to express my appreciation to Amoco Production Company for providing me the opportunity to publish the results of this study. This project involved the creative contributions of many people, and without the use of the multi-discipline approach, these results would never have been achieved. I especially would like to acknowledge the many people involved in this evaluation, specifically Scott Young, Chip Story, Terry Manning, Eric Djuvik, Kelly Tumino, Odelia Gurrola, Amy Horan, Dave Wright, Frank Sheppard, Pat McGrievy, Harold Cansler, Virginia Callaway, Chris Roth, Gary Caldwell, Carl Butler, John Jeffries, and Julie Spoth.
Barrell, K. A., 1997, Sequence Stratigraphy and Structural Trap Styles of The Tuscaloosa Trend. Transactions, Gulf Coast Association of Geological Societies, vol. 47, p. 27-34.
Sneider, R. M., 1986, The synergistic team approach-its value to petroleum exploration and development in the next decade. Proceedings, Eighth Australian Geological Convention, Adelaide, Australia, p. 16-19.