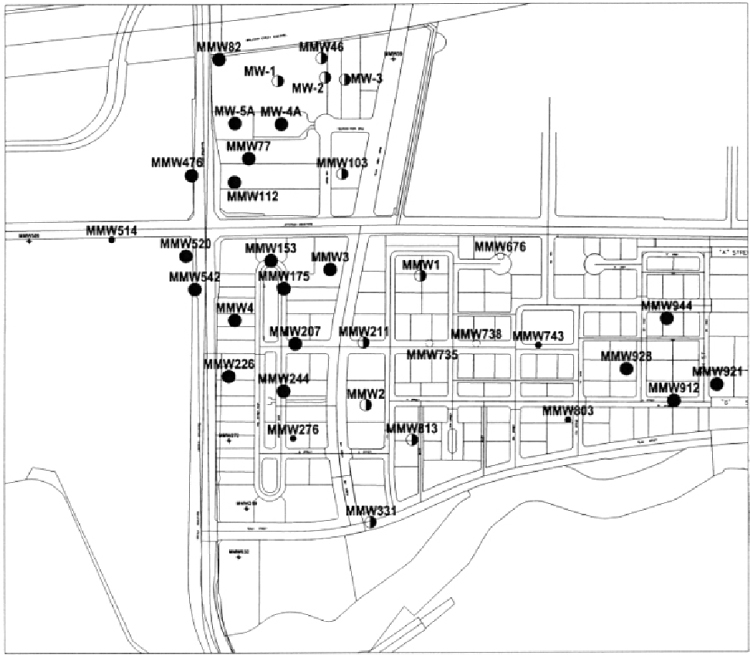
Figure 4. A map view of the isotopic data shown in Figure 3 defines the two
main methane anomalies, and suggests that the isotope values in the forty-one
monitor wells are controlled by proximity to source. The two most thermally
mature, and uniform isotope anomalies within the gravel aquifer at depth provide
confirmation of the two major ![]() soil
soil![]() gas anomalies. Surface macroseeps, found by
the
gas anomalies. Surface macroseeps, found by
the ![]() soil
soil![]() gas survey have been collected and analyzed that match exactly to the
compositions of the gases found in the aquifer.
gas survey have been collected and analyzed that match exactly to the
compositions of the gases found in the aquifer.