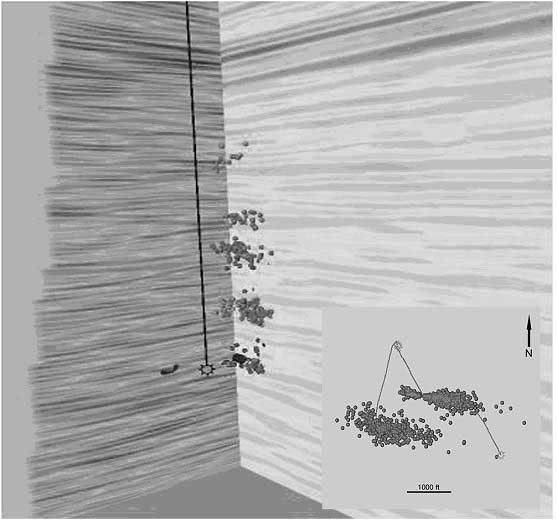
Figure 3. Multi frac stage microseismic events (circles) displayed in 3D surface seismic (right panel), 3D VSP (note the higher resolution) (left panel). The solid line indicates the well bore. The inset shows a map view of multi stage microseismic events for two deviated wells.