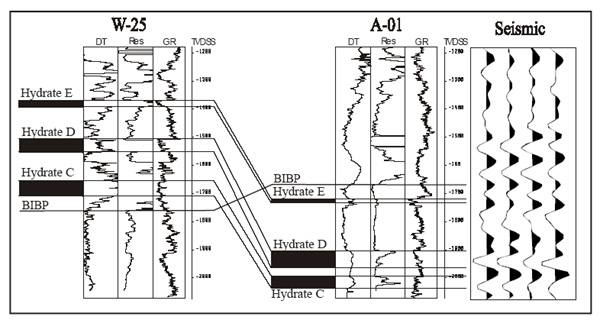
Figure 2. Well logs for wells WSak-25 and MPA-01 including sonic (DT), deep resistivity (Res) and gamma ray (GR); locations are shown in Figure 1. Gas-hydrate inferences for three correlative gas hydrate-bearing units, E, D and C (Collett, 1988), exhibit high velocities and high resistivities. Gamma-ray logs indicate that these gas hydrates occur in thin, sandy intervals. Note that the base of ice-bearing permafrost (BIBP) crosscuts stratigraphy and may interfere with seismic response to gas hydrate. WSak-25 BIBP may be up to 200 feet shallower than indicated and/or occur commingled with gas hydrates. Seismic traces shown on right are scaled to the well logs, taken near the well bore of MPA-01, to show the qualitative resolution of the data and the waveform response to gas-hydrate-bearing intervals.