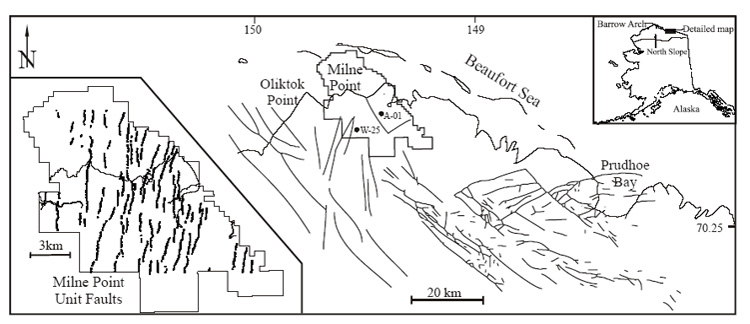
Figure 1. Regional map of structural trends at depth for current production areas; encompassing Prudhoe Bay, Kuparuk River (south of Oliktok Point), and Milne Point oilfields. Depths of these structures vary, but all are deeper than the zone of gas-hydrate stability, which is the focus of this study. Inset on the right shows location of the North Slope of Alaska, the trend of the Barrow Arch, as well as the location of the detailed structure map. Boundary for the Milne Point Unit indicates extent of 3-D seismic data utilized in this study. Location of wells WSak-25 and MPA-01 are identified in Milne Point. Inset on the left details normal faults within the HSZ interpreted from 3-D seismic data. Note NW-trending truncation of NE-trending faults in the center of the MPU. Modified from Collett et al. (1988).