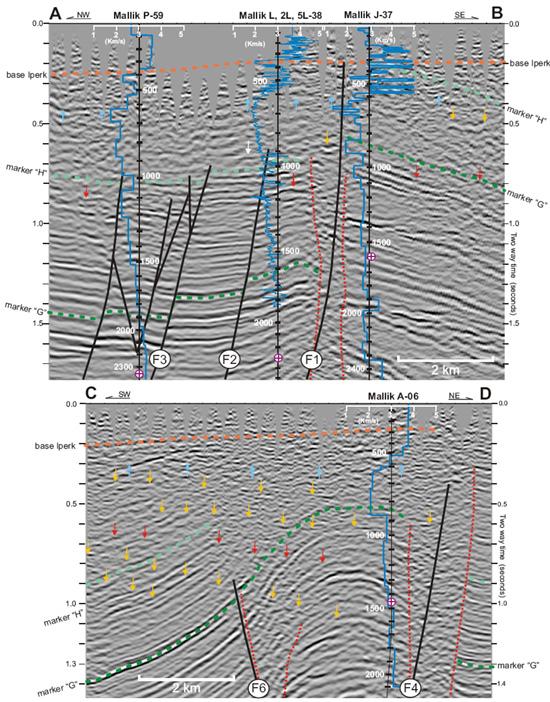
 Figure 2. Interpreted Mallik 3D seismic lines A-B and C-D (location in
Figure 1). Overlain at Mallik area well locations are
checkshots or VSP-corrected velocity curves, depth scales (m KB), and biostratigraphic datum. Blue arrows indicate
base of ice-bonded permafrost and red arrows indicate weak seismic expression closest to the estimated base of methane
hydrate stability. Vertical zones of amplitude /frequency /coherency “wash-out” are outlined with red-dashed lines. Yellow
arrows indicate speculated seismic multiples, top GH energy, paleo-GH levels or diagenetic acoustic overprints possibly
the legacy of deeper paleo-hydrate levels. Seismic data are from pre-stack time migrated processing.
Figure 2. Interpreted Mallik 3D seismic lines A-B and C-D (location in
Figure 1). Overlain at Mallik area well locations are
checkshots or VSP-corrected velocity curves, depth scales (m KB), and biostratigraphic datum. Blue arrows indicate
base of ice-bonded permafrost and red arrows indicate weak seismic expression closest to the estimated base of methane
hydrate stability. Vertical zones of amplitude /frequency /coherency “wash-out” are outlined with red-dashed lines. Yellow
arrows indicate speculated seismic multiples, top GH energy, paleo-GH levels or diagenetic acoustic overprints possibly
the legacy of deeper paleo-hydrate levels. Seismic data are from pre-stack time migrated processing.