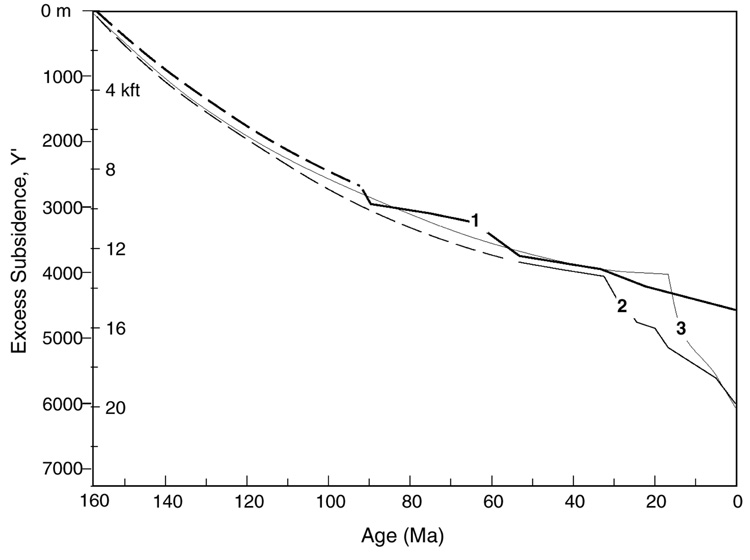
Figure A-4-Graph of backstripped excess subsidence versus age for three positions indicated in Figure 14. Dashed lines are extrapolated to Jurassic time based on depth to the Louann salt level. No subsidence anomaly is apparent at position 1, but successive positions southward (2 and 3) show a large anomaly of excess subsidence following the prograding depocenters. This anomaly is interpreted as a wave of salt-withdrawal subsidence.