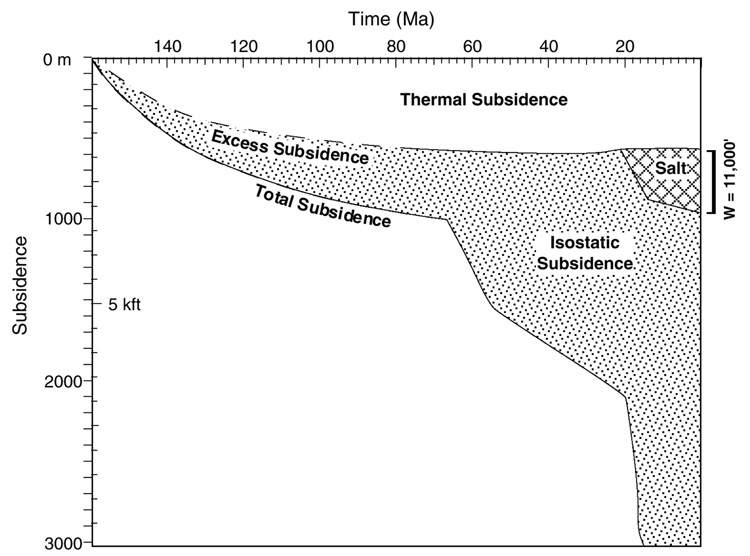
Figure A-3-Graph of subsidence versus age using restored decompacted thicknesses above basement at the south end of Figure 14 (onshore southern Louisiana). Dashed lines are extrapolated to Jurassic time based on depth to the Louann salt level. The backstripped excess subsidence curve is interpreted to represent thermal subsidence, very nearly flat by 50 Ma. The large anomaly in Miocene time (last 20 m.y.) is interpreted to be the result of salt withdrawal.