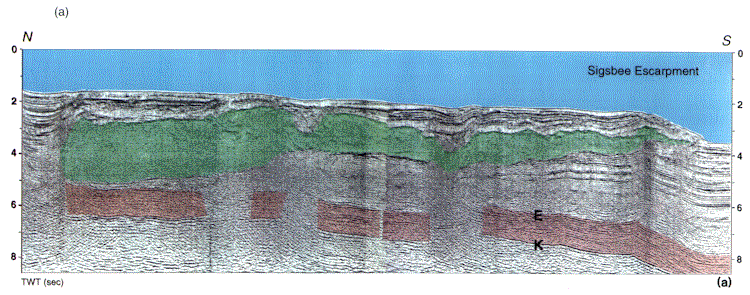
Figure 36(a)-Comparison of seismic profiles across the Sigsbee salt body (green), southwestern Louisiana slope. Profile used for the frame section and reconstructions (Figure 32, Figure 33, Figure 34, Figure 35) shows the base of the Sigsbee salt sheet reaching as deep as a reflector tentatively correlated to the Eocene (top of brown interval).
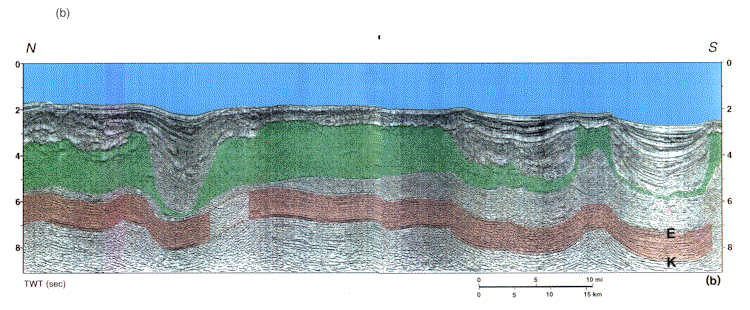
Figure 36(b)-Profile farther northwest shows the base of salt (green) continuing above through-going Eocene(?) and older abyssal plain strata (brown interval) for an additional 30 km northward. Apparent structure on the base of salt and subsalt strata is due to the velocity contrast of salt and sediment. E=Eocene, K = Cretaceous. See Figure 2 for locations.