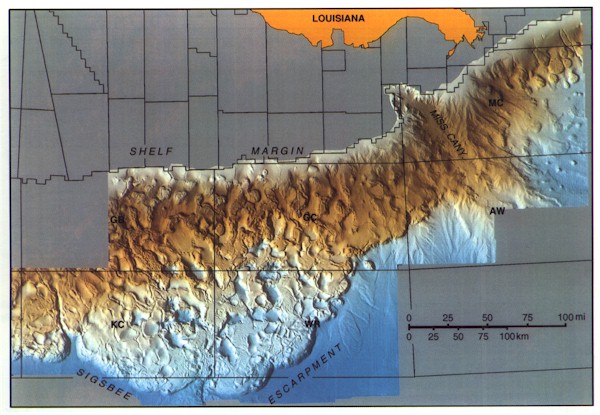
Figure 4-Artificial illumination display of seafloor structure, Louisiana slope. Data are from the NOAA multibeam bathymetric survey. Vertical exaggeration is 10 times; illumination is from the west-southwest. Colors from gray, brown, light blue, to dark blue indicate shallow to deep water. OCS protraction areas are outlined in black: KC = Keathley Canyon, GB = Garden Banks, GC = Green Canyon, WR = Walker Ridge, MC = Mississippi Canyon, and AW = Atwater.