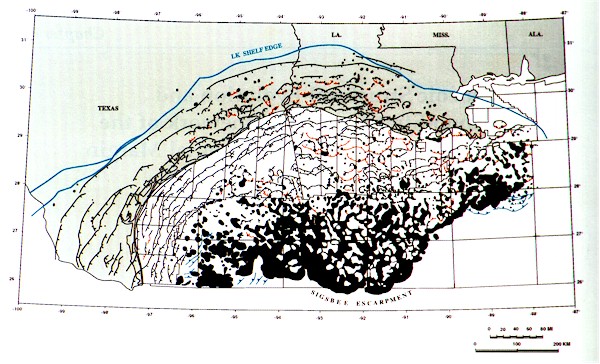
Figure 1-Structural summary map of the northern Gulf of Mexico Basin. Black areas are shallow salt bodies. Tick marks are on the downthrown side of major growth faults: black = seaward dipping; red = landward dipping (counter-regional); blue = thrust faults.