GCJoint Impedance Inversion Transforms Aid Interpretation*
Satinder Chopra¹, Ritesh Kumar Sharma¹, Mohammad Hossein Nemati¹, and Peter Cary¹
Search and Discovery Article #41667 (2015)
Posted August 24, 2015
*Adapted from the Geophysical Corner column, prepared by the authors, in AAPG Explorer, July, 2015, and entitled "Impedance Inversion: Big Aid In Interpretation".
Editor of Geophysical Corner is Satinder Chopra ([email protected]). Managing Editor of AAPG Explorer is Vern Stefanic. AAPG © 2015
¹Arcis Seismic Solutions, TGS, Calgary, Canada ([email protected])
Having first examined the poststack and prestack methods of seismic impedance inversion (Search and Discovery Article #41622 and #41664) we now end the three-part series by turning our attention to joint inversion of multicomponent data.
Multicomponent seismic data offers many advantages for characterizing reservoirs with the use of PP and PS data. A number of articles discussing the applications of multicomponent data previously were published in the Geophysical Corner by Bob Hardage and his co-authors (Search and Discovery Articles #40688, #40701, #40792 and #40888). They can be referred to for more information.
|
♦General statement ♦Figures ♦Method ♦Example ♦Conclusion
♦General statement ♦Figures ♦Method ♦Example ♦Conclusion
♦General statement ♦Figures ♦Method ♦Example ♦Conclusion
♦General statement ♦Figures ♦Method ♦Example ♦Conclusion
♦General statement ♦Figures ♦Method ♦Example ♦Conclusion
♦General statement ♦Figures ♦Method ♦Example ♦Conclusion
♦General statement ♦Figures ♦Method ♦Example ♦Conclusion
♦General statement ♦Figures ♦Method ♦Example ♦Conclusion |
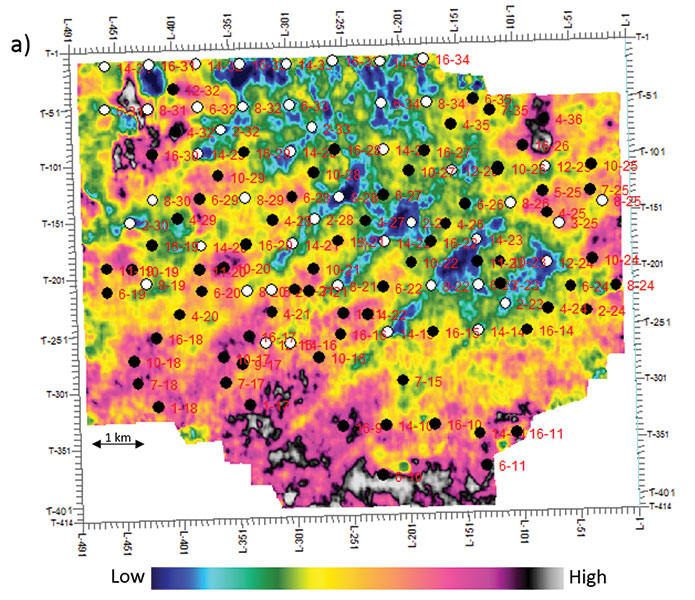
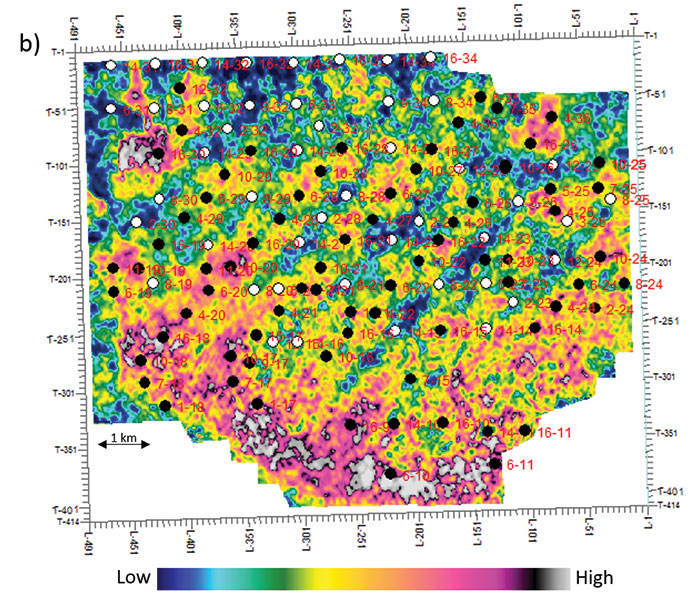
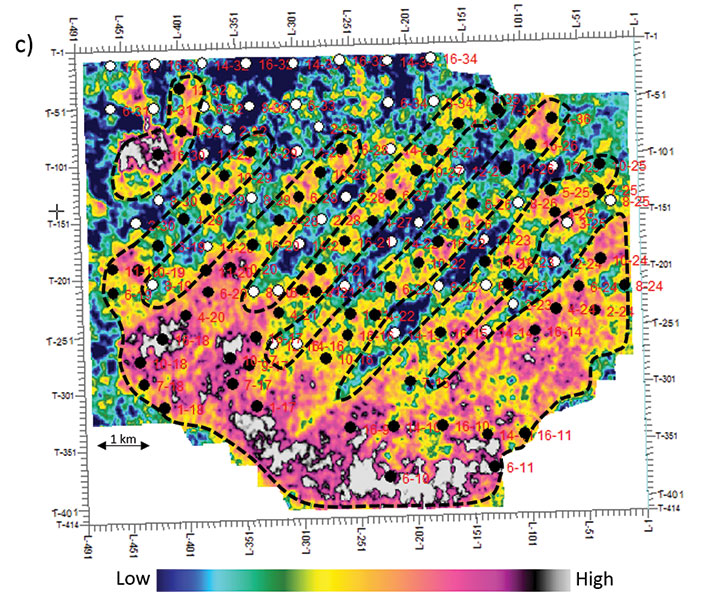
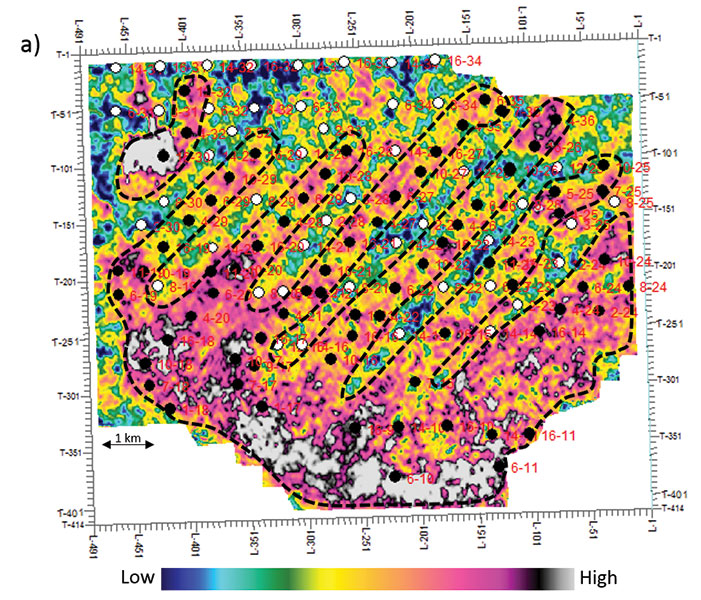
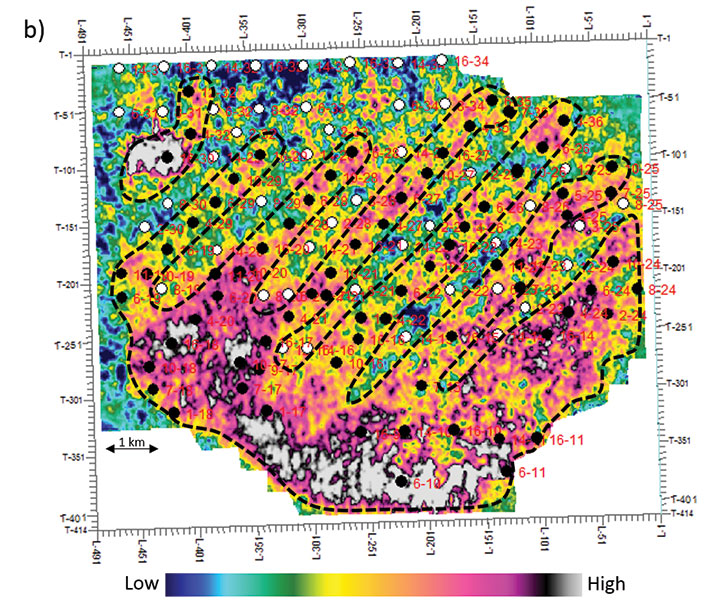
Inversion of P-wave data together with S-wave data is referred to as joint inversion, which makes use of the amplitudes and travel times of the P-wave and S-wave data for estimating P-impedance, S-impedance and density attributes that provide a more robust means of fluid detection and lithology prediction. After processing of multicomponent seismic data, the outputs are PP wave data processed in PP two-way time and PS wave data processed in PS time scale. For carrying out any consistent analysis, the first step is to carry out an accurate PP and PS time correspondence, which is accomplished by tying with PP and PS synthetic seismograms respectively, generated over the same range of frequency bandwidth as the input reflection data. This process is referred to as registration, and it usually is carried out by matching the corresponding correlative events on the PP and PS data volumes, and then mapping or shrinking the PS time scale to the PP time scale. This is followed by estimating the VP/ VS ratios for the intervals between the picked horizons from the PP and PS travel times. Joint inversion can be carried out with poststack as well as prestack multicomponent seismic data: In each case the output from joint inversion is P-impedance, S-impedance and density data. Here is a case study from central Alberta, Canada, that demonstrates the application of joint inversion. The Pembina Field in central Alberta is a mature field that has been producing since the late 1950s. The Cardium Formation, due to its favorable reservoir formation characteristics, has been producing a mix of light oil and liquids-rich natural gas for the last five decades. It comprises two sandstones: The upper sandstone and the conglomerates are separated by an erosional unconformity surface. All three zones (conglomerates, upper sandstone and lower sandstone) are oil and gas producers and collectively comprise the Cardium Formation. The upper sandstone has a higher porosity (about 15 percent), followed by the lower sandstone (about 12 percent) and then the conglomerates (about 5 percent). Consequently, the production from these formations is also in that order. The Cardium Formation is underlain by a thick package (more than 300 meters) comprising the Blackstone shale units. Overlying the Cardium is another 320-meter thick shale (Lea Park) extending up to the Wapiti Formation. These thick shale units provide seals to the Cardium Formation and prevent leakage of trapped hydrocarbons. As is common knowledge, when a field has been producing for some time, the reservoir pressure gradually falls and reaches a stage when it is not sufficient to bring the oil to the surface. Sometimes oil is lifted to the surface by means of pumps, in a process referred to as artificial lift. More profitably, the pools are subjected to secondary recovery processes, wherein fluids such as water or gas are injected into the reservoir to artificially increase the pressure and thereby force the oil to the surface. When water is used in this process, the recovery process is called water-flooding. As the Pembina fields have been producing for the last five decades, most of the Cardium reservoirs are now under water-flooding, and the operators are always aiming to economically optimize the water-flooding so as to maximize production. For the area selected for this study, the injection wells have been drilled in linear patterns along the subsurface stress direction that is predominantly northeast-southwest. The production wells are drilled in between the lines of injection wells so as to optimize the overall sweep efficiency for maximum oil recovery. Such type of water-flood networks not only arrest the production declines, but enable enhanced production and add to the overall reserves of the fields. Core and well log analysis indicate that both the net pay and porosity in the Cardium Formation show northwest-southeast trends and are seen as low and high amplitudes on the seismic data. As a result, 3-D seismic can be used to evaluate the reservoir potential of the Cardium and for identifying areas of increased pay and possibly production. The multicomponent 3-D seismic dataset used for this study is located at the lower end of the Pembina Field and was acquired and processed in 2014 and has a bin size of 20 x 20 meters. As stated above, there are a number of injection and production wells that fall on the 3-D survey, but none of them have been logged. Consequently, a well with log curves located just outside the 3-D survey was projected inside it, and the correlation of PP- and PS seismic data with the synthetic curves data is shown in Figure 2, and looks reasonably good. As indicated on the litho-column to the left, the Cardium Formation is thin in this area, varying in thickness from five to 25 meters. The frequency content of the PS data is seen to be lower that the PP data, which is expected. Simultaneous inversion was run on the PP data, followed by both poststack and prestack joint inversion on the PP and PS seismic data. In Figure 3 we show P-impedance equivalent stratal slices from simultaneous inversion (Figure 3a), PP-PS joint poststack inversion (Figure 3b), and PP-PS joint prestack inversion (Figure 3c). The definition of the northeast-southwest trends is seen on each of these displays, but seems to be more pronounced on the prestack PP-PS inversion as seen in Figure 3c. These trends are as per expectation. As production is supported by water injection, the injected reservoir zones experience high water sweep pressures, producing low impedance (velocity and density) signatures on the seismic, which get translated into low impedance patterns seen trending in the northeast-southwest direction. Similarly, in Figure 4 we show density equivalent stratal slices from the PP-PS poststack (Figure 4a) and prestack (Figure 4b) inversions. Again, notice the northeast-southwest trends are much better defined on the density derived from prestack inversion. These and earlier displays not only confirm the correct patterns for the injection and the production wells on the 3-D survey, but show up a large area with higher density in the lower portion of the survey that apparently could be exploited for horizontal infill drilling. These examples illustrate the advantages of joint inversion, which could be utilized for more accurate seismic interpretation or any subsequent reservoir characterization exercises that may be undertaken. Interestingly, the oil production data from the wells in the lower portion of the survey do not necessarily indicate higher volumes. This suggests that there are other contributing complications that have not been completely understood, and more work needs to be done for that. Nevertheless, prestack joint inversion has portrayed a clearer picture than the other types of inversions attempted earlier, and so holds promise as a definite aid in seismic interpretation. |