GCAttribute Analysis of Mid-Continent Washes*
Ryan Fairfield¹ and Renjun Wen²
Search and Discovery Article #41616 (2015)
Posted April 20, 2015
*Adapted from the Geophysical Corner column, prepared by the authors, in AAPG Explorer, April, 2015. Editor of Geophysical Corner is Satinder Chopra ([email protected]). Managing Editor of AAPG Explorer is Vern Stefanic. AAPG © 2015
¹SM Energy, Tulsa, Oklahoma, USA ([email protected])
²Geomodeling Technology Corp, Calgary, Canada
The Anadarko Basin granite wash play has been considered difficult to interpret both geologically and geophysically. Consequently, the application of seismic attribute analysis to Mid-Continent washes has not been widely published.
SM Energy's Mid-Continent granite wash asset covered a portion of a prolific Missourian age wash trend. In 2010, a competitor drilled a successful horizontal well, Well #1, in the interval with excellent initial production rates (Figure 1). Adequate well control existed to generally map the trend across the acreage – however, some uncertainty remained regarding the extent of the sand trend in areas that lacked well control. In order to gain insight into these areas, a seismic attribute study was conducted over a 14-square-mile portion of SM Energy's 3-D seismic holdings.
|
♦General statement ♦Figures ♦Background ♦Method ♦Workflow ♦Conclusions ♦Acknowledgment
♦General statement ♦Figures ♦Background ♦Method ♦Workflow ♦Conclusions ♦Acknowledgment
♦General statement ♦Figures ♦Background ♦Method ♦Workflow ♦Conclusions ♦Acknowledgment
♦General statement ♦Figures ♦Background ♦Method ♦Workflow ♦Conclusions ♦Acknowledgment
♦General statement ♦Figures ♦Background ♦Method ♦Workflow ♦Conclusions ♦Acknowledgment
♦General statement ♦Figures ♦Background ♦Method ♦Workflow ♦Conclusions ♦Acknowledgment
♦General statement ♦Figures ♦Background ♦Method ♦Workflow ♦Conclusions ♦Acknowledgment
♦General statement ♦Figures ♦Background ♦Method ♦Workflow ♦Conclusions ♦Acknowledgment |
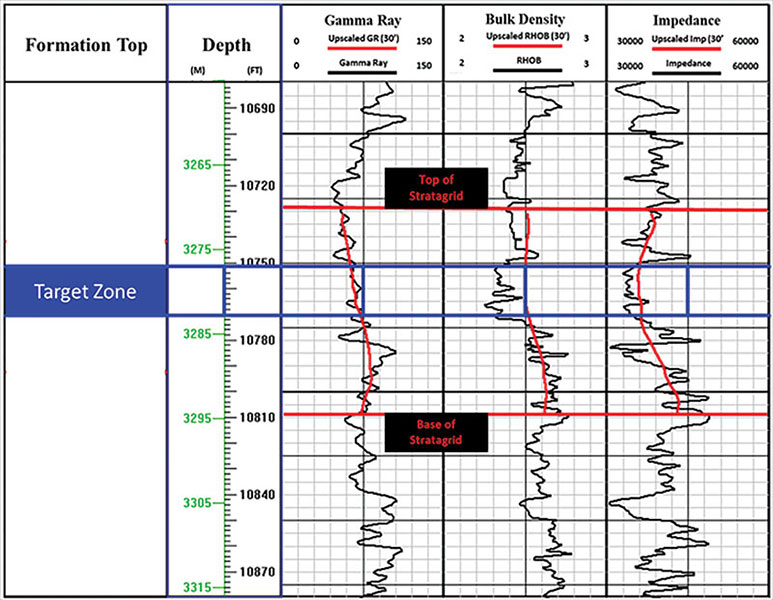
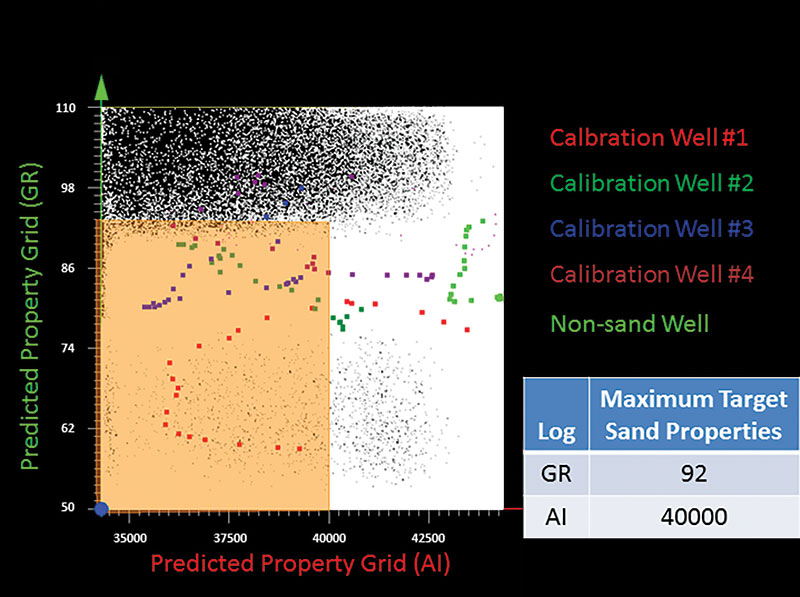
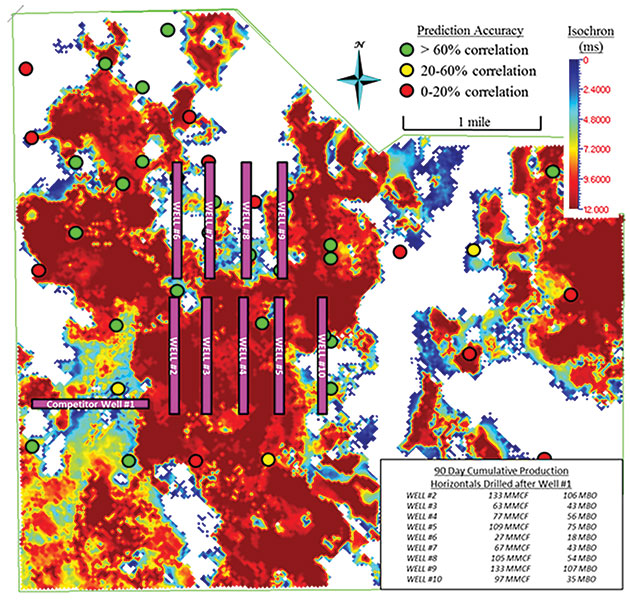
The mature, oil and gas-producing Anadarko Basin granite wash play is a series of stacked fanglomerate reservoirs with sands of varying mineralogies derived from the erosion of the Wichita-Amarillo Mountain Front. The reservoir, which is the focus for this study, is a Missourian age wash. Petrophysical properties from local well control suggest that the reservoir sand in the study area consists of a more traditional mineralogical makeup (quartz and carbonate) rather than the feldspar rich, arkosic sands which exist in a deeper portion of the play. For the purpose of this study, low acoustic impedance and low gamma-ray are assumed to indicate clean, porous sand within the reservoir. Thicknesses of the sand trend range from seven feet at its thinnest recorded location to over 90 feet in the heart of the trend. Average porosities of the target sand (estimated from neutron/density porosity Here is a summary of the workflow used to predict critical rock properties through the application of statistical analysis of 3-D seismic attributes: 1) Generate post-stack seismic attributes from 3-D seismic. 2) Interpret top and base of target, tied by 3) Build strata-grid from interpreted time horizons conformable to target area and extract each attribute to the strata-grid. 4) Upscale well 5) Correlate attributes to upscaled well 6) Apply neural network prediction to combine the statistically significant attributes and generate a predicted property grid representing the property of the correlated log. 7) Use cross-plots and define the target sand. 8) Generate geobodies to compare seismically-derived sand thickness estimation to well 9) Visually compare morphology of geobodies to well log-derived sand thickness map. 1) Generation of Post Stack Seismic Attributes The 3-D seismic data used for the attribute analysis were excellent in quality with a 2 ms sample rate, neutral phase and 110 feet x 110 feet bin spacing. Numerous post stack attributes – including spectral decomposition – were generated from the input 3-D seismic data set. Although there are some redundancies when calculating attributes, measuring stratigraphic changes was the primary goal as opposed to the measure of structural changes. 2) Attain an Accurate Thirty-eight vertical well penetrations with digital It was from these wells that the location of the target sand was identified within the seismic trace, allowing time horizons that bracket the sand to be mapped in the seismic section. Four of these eight wells contained excellent examples of the target sand and would serve as the calibration wells. 3) Generate a Strata-Grid, Extract Attributes and Upscale Subject Well A "strata-grid" was created using the interpreted horizons to encompass the target sand. Each of the post stack attributes (in addition to the original stacked amplitude volume) was extracted to the strata-grid. Several well An appropriate upscaling window size was finally adopted after testing the sensitivity of the size to the correlation coefficient between seismic attributes and the upscaled well 4) Correlate Attributes to Upscaled Generated seismic attributes were correlated to each subject log. The set of attributes, which correlated highly to an upscaled log, were then input to neural network prediction. The resulting predicted property grid emulates the subject log (Figure 3). 5) Cross-Plot of Predicted Property Grids, Refinement of Cross-Plot Polygon and Geobody Extraction First, the target zone within the predicted gamma-ray and impedance grids were cross-plotted with samples from the calibration wells highlighted (Figure 4). Upper-range sand cutoff values from the upscaled gamma-ray and impedance The polygon shape and size was further refined by plotting extracted predicted property grid values at blind well locations. By highlighting those values on the cross-plot, we interactively QC'd the shape of the cross-plot polygon by turning on the wells with no known sand, which should fall outside the sand polygon. A geobody map was generated from this polygon, representing the sand properties defined by the subject 6) Attempts to Avoid Spurious Correlations Spurious correlations are a constant concern in attribute analysis. If seismic attributes are to be correlated with First, at least two Criteria 1 and 2 were addressed in the discussion on upscaling window size selection. Rather than using one well for calibration, which may not capture the variability of the target sand in the study area, a total of four wells with good quality It also is important that the target reservoir be sufficiently sampled to make the correlation coefficients statistically significant. A statistical sample of points was able to be attained from within the sand zone itself. A minimum of 15 is necessary, while greater than 50 were attained in this study. 7) Validating the Results through Reliability Analysis of Blind Wells Recall, the primary focus of this study was determining morphology more so than the absolute thickness of the reservoir. However, a blind well analysis was conducted to assess reliability of the prediction. A sand isochron was extracted at each well location that was used in the original well log-derived sand thickness map. Using a well-derived conversion velocity of 12,000 feet per second, an isopach of the attribute-derived sand was estimated. Of the 38 wells used in the study, 23 wells had a 60 percent or better prediction to the log-derived sand thickness (Figure 5). Many of the wells that correlated poorly were near predicted edges of the sand trends, which may end abruptly; thus under- or over-estimating. 8) Activity and Results SM Energy completed its first horizontal producer in the play, Well #2, with 90-day cumulative production of 133 MMCFG and 106 MBO. Well #3 was completed several months after Well No. 2 and likely underperformed due to depletion. Wells #4 and #5 followed with production improving to the east. Five additional horizontal wells were drilled by other operators with outcomes that appear to correlate to the predicted sand map generated by this workflow. Four wells were drilled to the north with mixed results – however, the best well does lie in a predicted sand trend. Additionally, Well #10 was proposed to SM Energy and this attribute work was instrumental in the decision to not participate in the well. Using commercially available seismic attribute analysis software, a porous sand trend was derived using combined post-stack attributes calibrated to well control. Although reliability suffered in some portions of the study area, 60 percent of the blind wells had greater than a 60 percent match to log-derived sand thickness measurement. Furthermore, when doing a simple visual comparison of the attribute-derived porous sand map to the log-derived sand map, there are undeniable morphologic similarities. This demonstrates the ability for analyses of this type to extrapolate desirable sand trends away from existing well control. This workflow shows the potentially valuable information that standard, full-stack 3-D seismic data, coupled with the right reservoir characterization tools, can yield to act quickly in areas that are sparsely drilled. The authors thank CGG for permission to use its data in this study, as well as the input of AAPG member Matt Stone of Petro-Hunt LLC. |