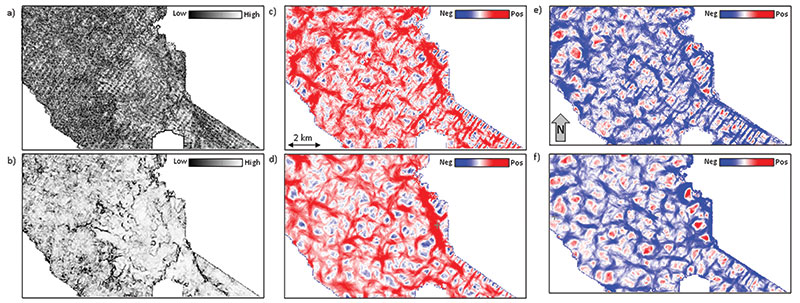
Figure 10. Time slices at 158 ms through coherence volumes (a and b), most-positive curvature (c and d), and most-negative curvature (e and f) computed from amplitude data (above) before, and (below) after 5-D interpolation. Notice the acquisition footprint has been suppressed after 5-D interpolation. (Data courtesy of Arcis Seismic Solutions, TGS)