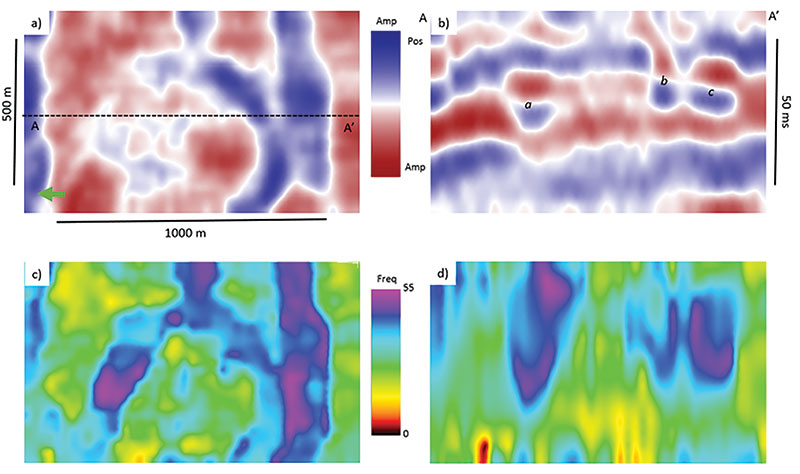
Figure 1. Panel (a) shows a time slice of seismic data containing channels, and (b) shows a vertical slice of the same seismic data taken perpendicular to the paleo-flow of the channels. Three channels – a, b and c – are identified. Panels (c) and (d) show the instantaneous frequency attribute for the views shown in (a) and (b), respectively. These images suggest frequencies in the 40-60 Hz range are likely associated with the channels.