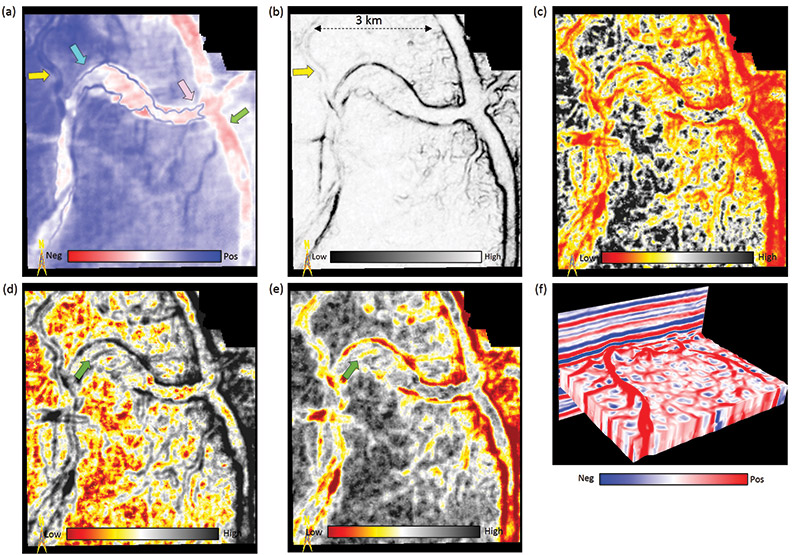
Figure 1. (a) Vertical and horizon slices through a seismic amplitude volume. The picked horizon followed a positive peak. The green arrow indicates a graben while the blue arrow indicates a channel exhibiting shallower differential compaction. Corresponding vertical and horizon slices through the 55 Hz spectral magnitude components computed using (b) a DFT in a short 30 ms window, and (c) a DFT in a longer 60 ms window. The same slices computed with a 55 Hz Morlet wavelet using (d) a CWT, (e) an S-transform, (f) a CPWT, and (g) a TCWT. As interpreters, we find (e) to provide higher lateral resolution of the high spectral magnitude distributary channel.