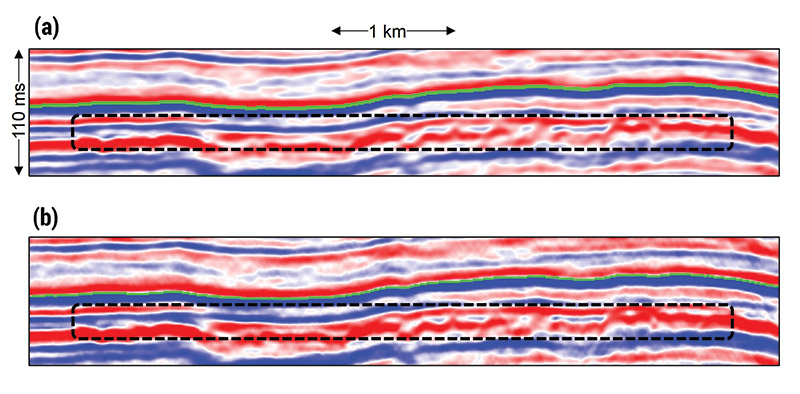
Figure 2. Vertical slice corresponding to the blue dotted line shown in Figure 3 through seismic amplitude volumes generated using 5-D interpolation generated from 5-D interpolated data at (a) nominal 20 m by 20 m, and (b) finer 10 m by 10 m bin size. Black box indicates channels delineated by coherence in Figure 3.