Click to view article in PDF format.
GC Phase
Phase Residules Can Reveal Stratigraphic Features*
Oswaldo Davogustto1
Search and Discovery
Article #41141 (2013)
Posted June
30, 2013
*Adapted from the Geophysical Corner column, prepared by the author, in AAPG Explorer, April, 2013, and entitled “It’s Just a Phase (Residue)”.
Editor of Geophysical Corner is Satinder Chopra ([email protected]). Managing Editor of AAPG Explorer is Vern Stefanic
1University of Oklahoma, Norman, Oklahoma ([email protected])
General Statement
In the March AAPG Explorer Geophysical Corner (Search and Discovery Article #41140) my colleagues Marcilio Matos and AAPG member Kurt Marfurt discussed the concept of phase unwrapping and the computation of phase residues. Here, we go deeper: I elaborate on the application of phase residues to seismic data – and the resulting subsequent interpretation of geological features.
Some geologically induced spatial discontinuities, such as channels and faults, easily can be identified as seismic phase shifts or amplitude anomalies when they are above seismic resolution – but phase shifts from condensed sections and erosional unconformities can be subtle and not as easily detected. Spectral decomposition is a proven, powerful means of identifying such discontinuities at specific frequencies that are otherwise buried in the seismic broadband response.
Although seismic acquisition and processing preserve seismic phase very well, little has been published about interpreting the phase components resulting from spectral decomposition. Morlet complex wavelet transform phase residues can improve seismic spectral decomposition interpretation by detecting the phase discontinuities in the joint time-frequency spectral phase component – by evaluating the phase shifts that are derived from thickness changes in a wedge model.
We unwrap phase the phase traversing a rectangular contour about each time-frequency sample. In almost all incidents, the contour closes. However, in some cases we have a +180 or -180 degree phase anomaly. We display the location of these phase residue anomalies and correlate them to stratigraphic discontinuities and inconsistencies in seismic data quality.
|
 General statement General statement
Figures
Example
Conclusion
Acknowledgment
General statement
Figures
Example
Conclusion
Acknowledgment
General statement
Figures
Example
Conclusion
Acknowledgment
|
Figure Captions
Example
We are able to map interference patterns between the wavelets that occur below seismic resolution. For example, here we apply the phase residues to a seismic dataset that served as one of the first published applications of spectral decomposition. The geology consists of an incised valley system in the Red Fork Formation of the Anadarko Basin that had at least five stages of incision and fill. Previous works described that the fill of the mentioned incised valley as comprising lag deposits, shales, coals, muddy sands and sands. This dataset also is known for the occurrence of invisible channels – channels that can be detected and correlated through logs, but that are below the resolution of the seismic data.
Based on the response of the phase residues and the tops interpreted from the logs, we identified the incision stages in the phase residues attribute. We interpreted each stage as a seismic horizon and constructed a geological model that honors the well, seismic and attribute data. This geological model can be further used in reservoir modeling for reservoir properties, such as net-to-gross, porosity and permeability, with the versatility that these properties can change as the depositional environment changed from stage to stage.
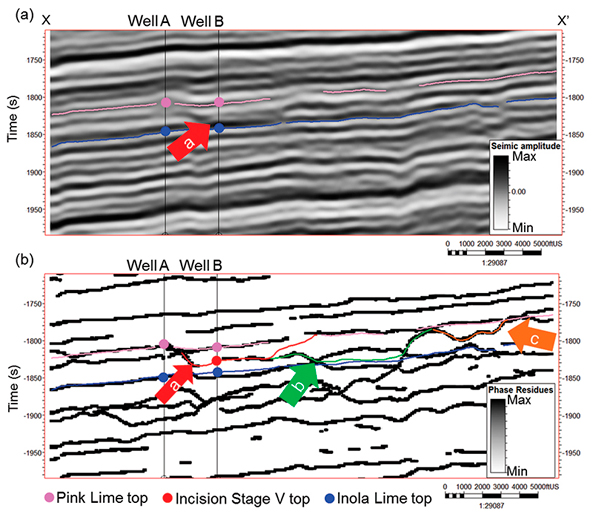
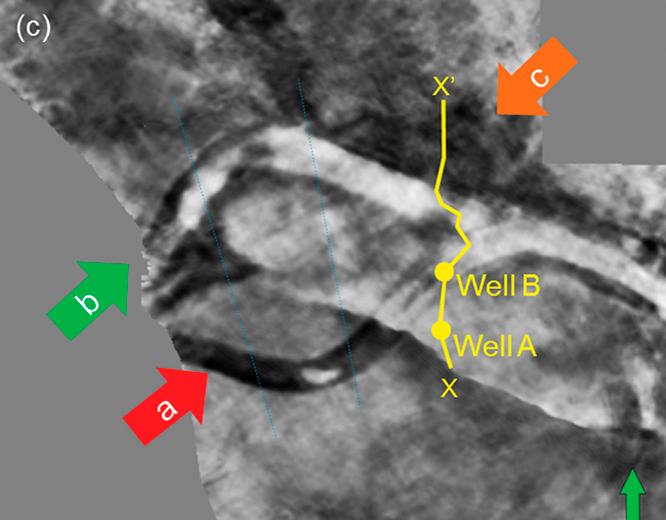
Figure 1 shows our well-to-seismic calibration for two wells, A and B. Locations of wells A and B are shown in
Figure 2c. The correlation coefficient is 75 percent for both wells. We identify very distinctive patterns in the log response for each well – well A is located in the regional Red Fork facies and shows faster P-wave velocity, whereas well B is located in the incised valley system facies and displays lower P-wave velocities from the sonic log.
In Figure 2 we display the seismic data (a), the phase residues response of a representative time section (b), and a time slice through seismic amplitude at 1.8 s (c). Seismic data (a) are able to resolve only one of the incision stages identified on the time slice of the data (c). This is a common problem in midcontinent datasets, where channels are identified in time slices but not on vertical sections. Using phase residues (b) we identify three anomaly responses that correlate with the channel-like features interpreted as incised valleys in the time slice data (c). Using the well and the phase residues data, we interpreted the incision stages.
In Figure 3 we show a chair diagram of the seismic data with a time slice at 1.8 s (a) and a 3-D view of the geo-cellular grid constructed from the combined well log and phase residues interpretation (b). This detailed geo-cellular grid allows us to model the properties of each incision stage and the regional Red Fork as a separate event with their on-reservoir properties and modeling technique.
Conclusion
In conclusion, we demonstrated how the use of phase residues can be effectively applied to reveal and enhance important stratigraphic features not otherwise revealed by conventional seismic amplitude. We have developed a workflow that combines well data with phase attributes in order to produce a well-to-seismic consistent stratigraphic model. consistent stratigraphic model.
Acknowledgment
I would like to thank Mark Falk and Al Warner for their support and advice in this project. I also would like to thank Chesapeake Energy Corporation and CGG-Veritas for donating the data for this project, and to Schlumberger and CGGVeritas for facilitating the software used in these displays.
Return
to top. |