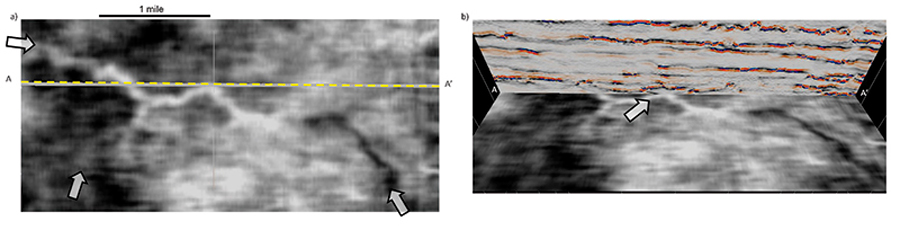
Figure 2. (a) A time slice at t=842 ms through a data volume acquired over Stratton Field, south Texas. Block arrow indicates a channel that gives rise to an amplitude anomaly. (b) The same time slice co-rendered with a vertical slice through the corresponding spectral phase residue volume. Seismic data courtesy of the University of Texas Bureau of Economic Geology.