![]() Click to view article in PDF format.
Click to view article in PDF format.
GCGeological Input Valuable in Seismic ![]() Velocity
Velocity![]()
![]() Analysis
Analysis![]() *
*
Supratik Sarkar1
Search and Discovery Article #41118 (2013)
Posted March 18, 2013
*Adapted from the Geophysical Corner column, prepared by the author, in AAPG Explorer, January, 2013, and entitled "Time to Pick? No Need to Fear 'Seismophobia' ". Editor of Geophysical Corner is Satinder Chopra ([email protected]). Managing Editor of AAPG Explorer is Vern Stefanic.
11Shell, Deepwater/Frontier New Ventures Business Development Group, Houston, TX ([email protected])
While seismic processing shops usually are the "professionals" when it comes to ![]() velocity
velocity![]()
![]() analysis
analysis![]() , the interpreter may have greater insight into the cause of the poor data quality. In such cases, repacking the velocities on a tight grid with a better knowledge of the geology can provide significant improvement.
, the interpreter may have greater insight into the cause of the poor data quality. In such cases, repacking the velocities on a tight grid with a better knowledge of the geology can provide significant improvement.
|
|
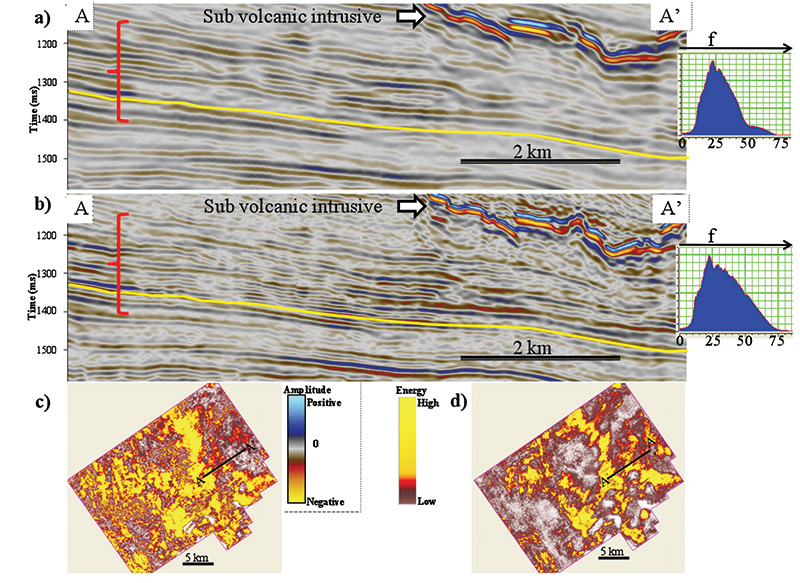
The following example (Figure 1) is from a tight turbidite formation in Mexico's Chicontepec Basin, where the data are often handicapped by interbed multiples from overlying shallow volcanic sills. While the deeper, non-targeted Cretaceous horizons were well resolved - appearing as coherent, broad-band reflectors - the shallower Eocene/Paleocene Chicontepec Formation reflectors of interest were "wormy" and narrow-band. The original data were prestack time-migrated using a Kirchhoff algorithm, resulting in 50-meter offset bins ranging between 50 and 3,000 meters. The preliminary interpretation of the stacked data showed significant reduction of data quality below the volcanics. Maps of the volcanics were made to highlight the problem areas. The original The key step was to take care beneath the volcanics to pick the slower Chicontepec reflectors rather than the strong, slightly faster interbed multiples (Figure 1a), resulting in the flattened gathers like the one shown in
Figure 1c. After the residual Descriptions of several volcanic episodes in east-central Mexico, from the Late Cretaceous to Miocene, have been published. The burial history chart from the adjacent Veracruz Basin - where petroleum generation occurred from Upper Jurassic source rocks similar to those in the Chicontepec play - shows that oil generation and This I wish to thank my adviser, AAPG member Kurt J. Marfurt from the University of Oklahoma, for his constant persistence and encouragement (to a geologist) to complete the work, part of which is reflected in this article. I also would like to thank Pemex, as well as Sergio Chavez Perez from IMP, who provided the data for working this project. I am thankful to AASPI consortium at OU for all the support. |
 General statement