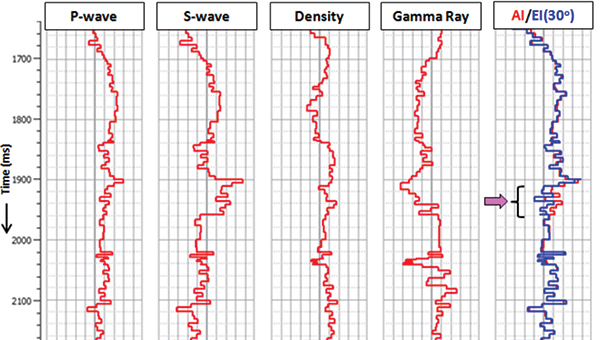
Figure 1. Display of P-wave, S-wave, Density and Gamma-Ray log curves from a well in the Magdelena Valley, Colombia. The low values for all the curve displays are to the left and high values to the right. To the far right is shown a comparison of an Acoustic Impedance (AI) curve with the computed Elastic Impedance (EI) (30°) curve. Notice the decrease in impedance (deviation in the blue and red curves) at the gas-producing zone as indicated with the purple arrow. (Data courtesy: PetroNorte, Colombia)