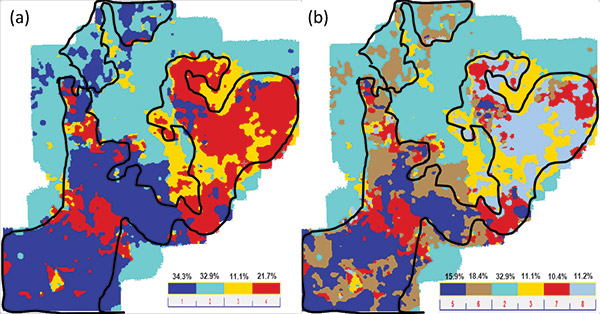
Figure 3. Waveform classification map generated by (a) using 4 classes; (b) subdividing classes 1 and 4 in (a). Notice the higher level of detail that is seen in (b) as compared with (a), within the sandstone boundary drawn in black.
Figure 3. Waveform classification map generated by (a) using 4 classes; (b) subdividing classes 1 and 4 in (a). Notice the higher level of detail that is seen in (b) as compared with (a), within the sandstone boundary drawn in black.