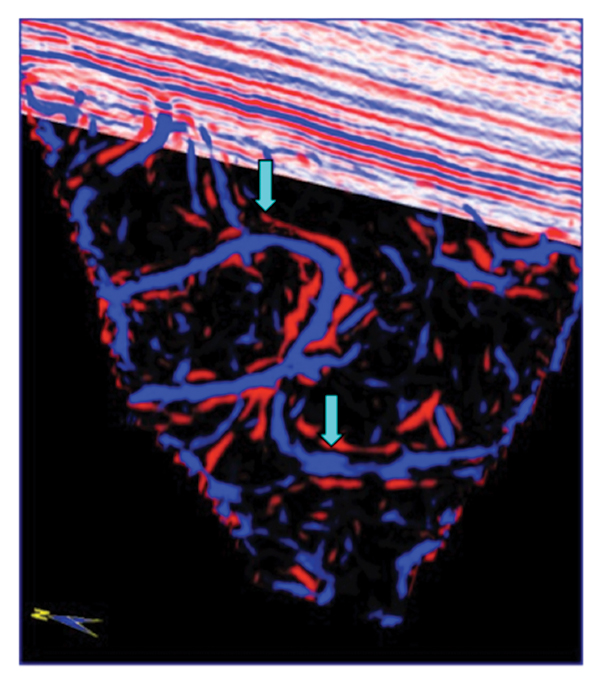
Figure 2. A chair display of the same volume shown in Figure 1 showing a vertical slice through seismic amplitude and a thin strat cube through co-rendered most-positive and most-negative curvature volumes where moderate curvature values are rendered transparent. Sediments within the channel have undergone more compaction and give rise to a strong negative curvature anomaly along its axis (in blue). Levees and channel edges appear as ridges and give rise to strong positive curvature anomalies (in red).