Click to view article in PDF format.
GCDifferentiating Fluid and Rock Boundaries with Seismic*
Bob Hardage1
Search and Discovery
Article #40962 (2012)
Posted June 25, 2012
*Adapted from the Geophysical Corner column, prepared by the author, in AAPG Explorer, June, 2012, and entitled "Seismic and Boundaries: Is It Fluid or Rock". Editor of Geophysical Corner is Satinder Chopra
([email protected]).
Managing Editor of AAPG Explorer is Vern Stefanic; Larry Nation is Communications Director. AAPG©2012
1 Bureau of Economic Geology, The University of Texas at Austin ([email protected])
General Statement
Identifying and mapping fluid-contact boundaries within a reservoir system with seismic technology are common objectives when doing a characterization of a hydrocarbon reservoir – and monitoring the movement of fluid boundaries during secondary and tertiary recovery processes of oil always has been essential for optimizing oil production. When attempting to analyze a fluid-contact boundary, a seismic interpreter must confront a challenging problem – how do you determine if a particular seismic reflection event is caused by a contact boundary between two different fluids, or by the contact between two different rock types? Starting in the 1980s people began to see that an efficient way to answer this question was to acquire both P- wave
wave and S-wave seismic data across a rock/fluid system that had to be interpreted.
|
 General statement General statement
Figures
Examples
Conclusion
Reference
General statement
Figures
Examples
Conclusion
Reference
General statement
Figures
Examples
Conclusion
Reference
|
Figure Captions
Examples
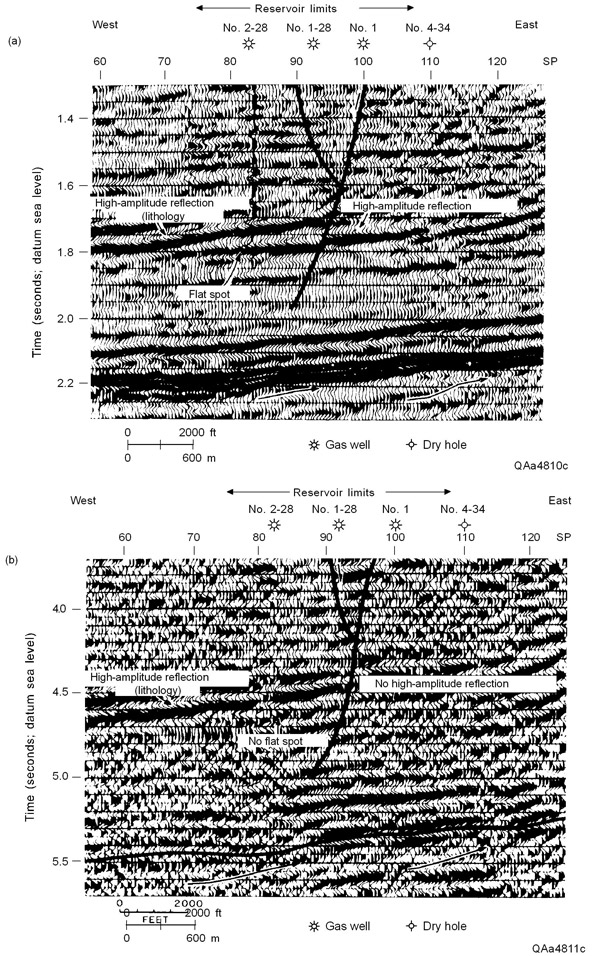
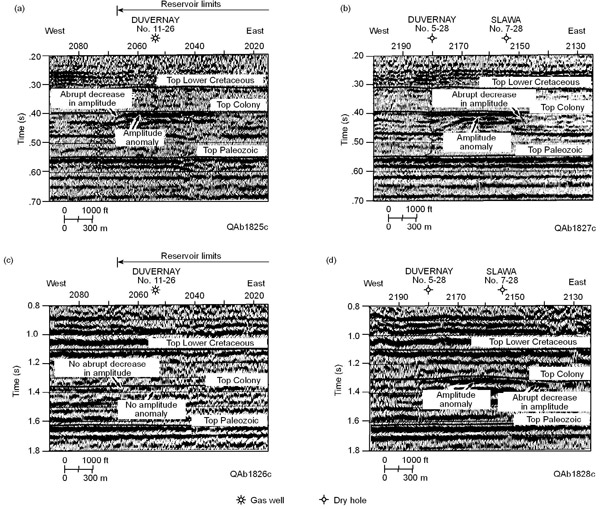
An example of a petrophysical interpretation that can be made from a combined analysis of P-wave and S-wave data is illustrated in Figure 1. These seismic profiles, published in 1985, follow the same track across a known gas field. Three reflection events are labeled on the P-wave profile; two of these profiles are absent on the S-wave profile. The common reflection that appears on both the P-wave and S-wave data is caused by a contact between two different rock types and is labeled as “lithology.” The two events that appear on the P-wave data but not on the S-wave data are contact boundaries between brine and gas. A second example that also appeared in the 1980s is presented as Figure 2. In this prospect area, the challenge was to determine if bold reflection events seen on P-wave data were caused by gas or by coal. If the cause was gas, the reflecting interface was a contact boundary between two fluids – gas and brine – embedded in the targeted sand interval. If the cause was coal, the reflecting interface was a contact boundary between two different lithologies – coal and its host sand. Wells were drilled that confirmed the following important findings:
- When a reflection event appeared on both P-wave and S-wave data, the event was caused by the contact between two different lithologies.
- When a reflection event appeared on P-wave data but not on S-wave data, the event was caused by a fluid-contact boundary (brine and gas in this instance).
Conclusion
The P-wave and S-wave seismic data displayed on Figure 1 and Figure 2 illustrate some important principles.
- First, P-wave seismic wavefields reflect from boundaries created by the contact between two different lithologies and also from the contact between two different pore fluids embedded in a constant-matrix host rock.
In contrast, S-wave seismic wavefields reflect from boundaries between contrasting lithologies but do not reflect from fluid contact boundaries unless there is a significant change in bulk density across the fluid boundary. Even when there is an appreciable change in bulk density between two contacting fluids, an S-wave reflection tends to be weak compared to the bold nature of its companion P-wave reflection from that same fluid-contact boundary.
- Second, when it is critical to identify and monitor fluid-contact boundaries, both P-wave and S-wave seismic data should be utilized.
S-wave data are needed to identify which P-wave reflections are associated with fluid boundaries; P-wave data are needed to map and quantify calendar-time changes in any reflection event that has been identified as a fluid-contact boundary. These well-established seismic principles are becoming more important now that there is increasing emphasis to sequester CO2 in brine-filled reservoirs.
Reference
Ensley, R.A., 1984, Comparison of P- and S-wave seismic data: A new method for detecting gas reservoirs: Geophysics, v. 49, p. 1420-1431. seismic data: A new method for detecting gas reservoirs: Geophysics, v. 49, p. 1420-1431.
Return
to top. |