Click to view article in PDF format.
GCDiscontinuous Stratigraphy Complicates Matching of Synthetic Seismograms to Regional  Seismic
 *
*
Bob Hardage1
Search and Discovery
Article #40926 (2012)
Posted May 14, 2012
*Adapted from the Geophysical Corner column, prepared by the author, in AAPG Explorer, May, 2012, and entitled "Geological Factors Can Lead to Poor Matches". Editor of Geophysical Corner is Satinder Chopra
([email protected]).
Managing Editor of AAPG Explorer is Vern Stefanic; Larry Nation is Communications Director. AAPG©2012
1 Bureau of Economic Geology, The University of Texas at Austin ([email protected])
General Statement
The traditional tool that interpreters have used to establish correspondences between subsurface stratigraphy and surface-measured seismic data has been synthetic seismograms calculated from well log data. In some instances, however, it is difficult to create an optimal-quality match between a synthetic seismogram and seismic data. We consider here possible geological reasons why poor matches sometimes occur — particularly in stratigraphic intervals where rock properties change laterally.
|
 General statement General statement
Figures
Example
Conclusion
General statement
Figures
Example
Conclusion
General statement
Figures
Example
Conclusion
|
Figure Captions
Examples
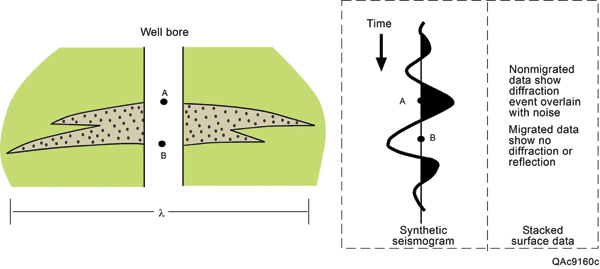
Consider the stratigraphic condition diagrammed on Figure 1. Here a well penetrates a sand body that has a lateral dimension less than that of the dominant wavelength λ of an illuminating seismic wavefield. Because sonic and density log data acquired in the well indicate a change in acoustic impedance at the top and base of the sand unit (interfaces A and B), a synthetic seismogram calculation using these logs will create a seismic reflection at the top and base of the sand. However, surface seismic data will not show such reflection events, because the lateral dimension of the sand body is too small to create a reflected wavefront. For a seismic wavefield having a dominant wavelength λ, the sand body along this particular profile is a point diffractor, not a reflector. You may see a diffraction in unmigrated seismic data, but after the data are migrated, the sand body probably would appear as only a mild amplitude variation on one or two data traces —
and would be ignored by an interpreter.
The principle illustrated by this example is that a synthetic seismogram will imply a reflection should be at the depth of the sand body, but migrated seismic data would not. This difference exists, even though the log data are correct and the synthetic seismogram calculation is accurate, because log data measure rock properties within only a meter or so of a wellbore. In contrast, a seismic wavefield averages rock properties over an appreciable area having a diameter of the order of its dominant wavelength λ.
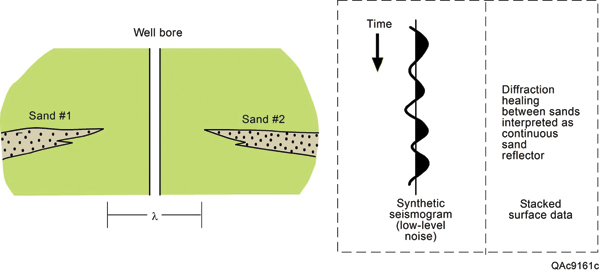
The reverse of this situation also can occur – that is, a synthetic seismogram can indicate no reflection is present at a depth where surface seismic data show a bold reflection. A stratigraphic condition that could create such a discrepancy is illustrated on Figure 2; here a well passes through a gap having a dimension of the order of λ between two laterally extensive sands.
Because log data acquired in the well indicate no impedance changes over the depth interval local to the sand bodies, a synthetic seismogram calculation will produce no reflection event. However, both migrated and unmigrated seismic data will show a reasonably continuous reflection event across the well position, with perhaps a slight amplitude anomaly at the well coordinate.
Again, the log data are correct, the synthetic seismogram calculation is correct and the seismic data are correct – yet the synthetic seismogram and the seismic data do not agree. The difference is caused by the fact that log data measure geological properties over a distance of one meter or less, but seismic data respond to geological properties over a distance of several tens of meters.
Conclusion
If one-meter geology is significantly different from 50-meter and 100-meter geology, there often will be mismatches between synthetic seismograms and seismic reflection data . .
Return
to top. |