![]() Click to view article in PDF format.
Click to view article in PDF format.
GCMulticomponent ![]() Seismic
Seismic![]() Augments
Augments ![]() Seismic
Seismic![]()
![]() Stratigraphy
Stratigraphy![]() Interpretation*
Interpretation*
Bob Hardage1
Search and Discovery Article #40888 (2012)
Posted February 20, 2012
*Adapted from the Geophysical Corner column, prepared by the authors, in AAPG Explorer, February, 2012, and entitled “Multicomponent ![]() Seismic
Seismic![]() Proves Its Value”. Editor of Geophysical Corner is Satinder Chopra
([email protected]).
Managing Editor of AAPG Explorer is Vern Stefanic; Larry Nation is Communications Director.
Proves Its Value”. Editor of Geophysical Corner is Satinder Chopra
([email protected]).
Managing Editor of AAPG Explorer is Vern Stefanic; Larry Nation is Communications Director.
1 Bureau of Economic Geology, The University of Texas at Austin ([email protected])
A fundamental thesis of elastic wavefield ![]() seismic
seismic![]()
![]() stratigraphy
stratigraphy![]() (or multicomponent
(or multicomponent ![]() seismic
seismic![]()
![]() stratigraphy
stratigraphy![]() ) is that S-wave
) is that S-wave ![]() seismic
seismic![]() data have equal value to P-wave data for geological interpretation.
data have equal value to P-wave data for geological interpretation. ![]() Seismic
Seismic![]()
![]() stratigraphy
stratigraphy![]() analyses, then, should be based on interpreting P and S data in combination (the full elastic wavefield) rather than restricting interpretation to only single-component P-wave data (traditional
analyses, then, should be based on interpreting P and S data in combination (the full elastic wavefield) rather than restricting interpretation to only single-component P-wave data (traditional ![]() seismic
seismic![]()
![]() stratigraphy
stratigraphy![]() ).
).
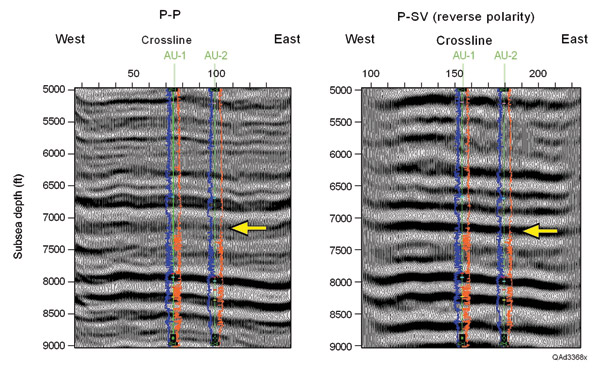
An example illustrating differences between P-wave and S-wave definitions of reflecting interfaces and the rock physics principles that cause this behavior are discussed here. The particular S-wave mode used in this example is the converted-shear (PSV) mode.
|
|
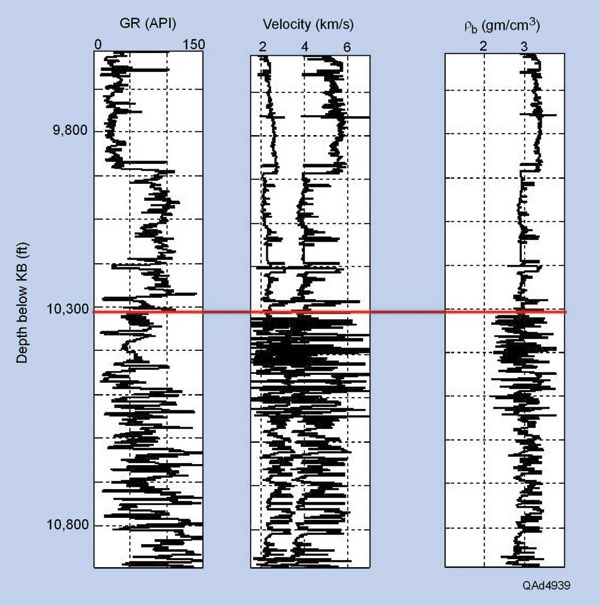
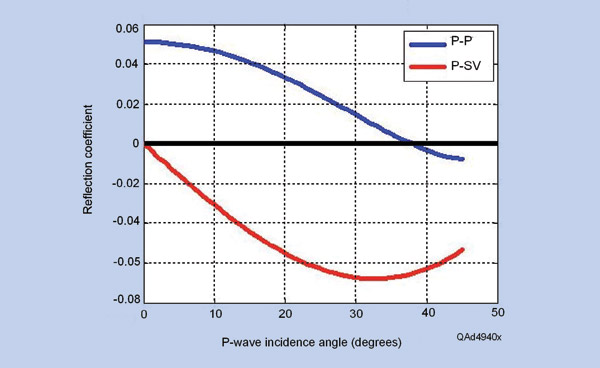
Marked contrasts between compressional-wave (P-P) and P-SV Well log data across the Wolfcamp interval local to this Compressional-wave and shear-wave velocities and formation bulk density values were averaged across 300-foot intervals immediately above and below this internal Wolfcamp interface, and these average rock properties were used to calculate the reflectivity curves shown as Figure 3. These curves confirm that for this particular interface, P-SV reflectivity is greater than P-P reflectivity when both reflectivity curves are evaluated over a large range of incidence angles. For example, P-P reflectivity exceeds 0.04 only for incidence angles between 0 and 15 degrees, but P-SV reflectivity has a magnitude greater than 0.04 for incidence angles between 15 degrees and 45 degrees – an angle range that is twice as large as that of the high-amplitude P-P response. Because the multicomponent The principle documented by this example is that an elastic wavefield |
 General statement