![]() Click to view article in PDF format.
Click to view article in PDF format.
GC![]() Euler
Euler![]() Curvature Helps Define Lineaments*
Curvature Helps Define Lineaments*
Satinder Chopra1 and Kurt J. Marfurt2
Search and Discovery Article #40838 (2011)
Posted December 12, 2011
*Adapted from the Geophysical Corner column, prepared by the authors, in AAPG Explorer, December, 2011, and entitled “![]() Euler
Euler![]() Curvature Can Be a Calculated Success”. Editor of Geophysical Corner is Bob A. Hardage
([email protected]).
Managing Editor of AAPG Explorer is Vern Stefanic; Larry Nation is Communications Director.
Curvature Can Be a Calculated Success”. Editor of Geophysical Corner is Bob A. Hardage
([email protected]).
Managing Editor of AAPG Explorer is Vern Stefanic; Larry Nation is Communications Director.
1 Arcis Corp., Calgary, Canada ([email protected])
2 University of Oklahoma, Norman, Oklahoma
Several (12, we think) types of seismic-based curvature attributes have been introduced the last few years – and of these, the most-positive and the most-negative curvatures described in last month’s article are the most popular. Most-positive and most-negative curvatures provide more continuous maps of faults and flexures than do maximum and minimum curvatures, because the latter tend to rapidly change algebraic sign at fault and flexure intersections.
Other attributes, such as mean curvature, Gaussian curvature and shape index, also have been used by a few practitioners. We describe here a technique called ![]() Euler
Euler![]() curvature, which has valuable applications.
curvature, which has valuable applications.
An attraction of ![]() Euler
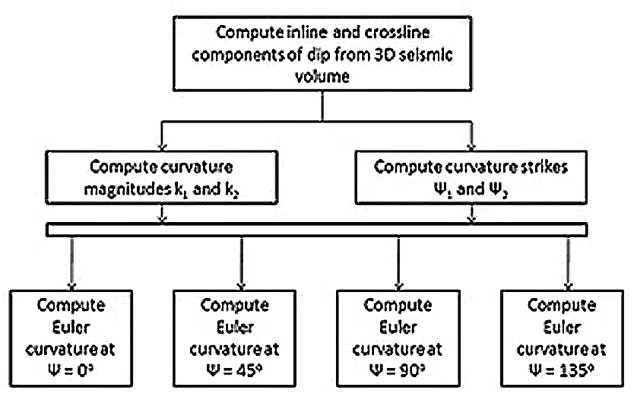
Euler![]() curvature is that it can be calculated in any desired azimuth across a 3-D volume to enhance the definition of specific lineaments. When this apparent curvature (the
curvature is that it can be calculated in any desired azimuth across a 3-D volume to enhance the definition of specific lineaments. When this apparent curvature (the ![]() Euler
Euler![]() curvature) is computed in several specific azimuths, the results are quite useful for interpreting azimuth-dependent structure. The flow diagram in Figure 1 explains the method for computing azimuth-dependent
curvature) is computed in several specific azimuths, the results are quite useful for interpreting azimuth-dependent structure. The flow diagram in Figure 1 explains the method for computing azimuth-dependent ![]() Euler
Euler![]() curvature.
curvature.
|
|
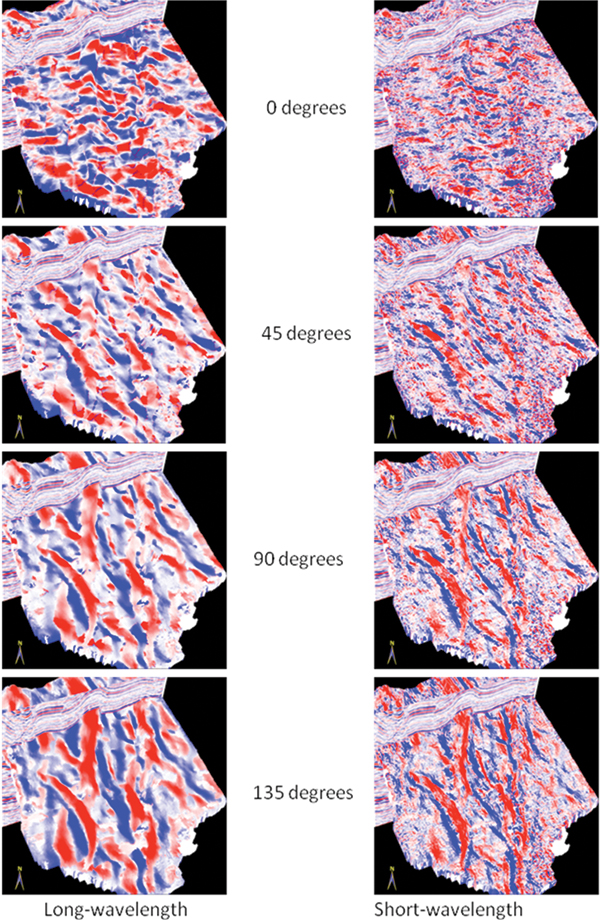
Mapping the intensities of fracture sets has been a major objective of reflection seismologists. Curvature, acoustic impedance and reflection coherence currently are the most effective attributes used to predict fractures in post-stack seismic Figure 2 shows 3-D chair displays through volumes of
The analysis area shown in these figures spans approximately 100 square kilometers. As emphasized in last month’s article, short-wavelength displays show more lineament detail and resolution than do long-wavelength displays. That principle is illustrated again by the displays in Figure 2. The important concept presented here is that there are obvious advantages in calculating
We thank Arcis Corporation for permission to show the
Copyright © AAPG. Serial rights given by author. For all other rights contact author directly. |
 General statement