![]() Click to view article in PDF format.
Click to view article in PDF format.
GCBlended ![]() Data
Data![]() Renders Visual Value*
Renders Visual Value*
Satinder Chopra1 and Kurt J. Marfurt2
Search and Discovery Article #40820 (2011)
Posted October 24, 2011
*Adapted from the Geophysical Corner column, prepared by the authors, in AAPG Explorer, October, 2011. Editor of Geophysical Corner is Bob A. Hardage ([email protected]). Managing Editor of AAPG Explorer is Vern Stefanic; Larry Nation is Communications Director.
1 Arcis Corp., Calgary, Canada ([email protected])
2 University of Oklahoma, Norman, Oklahoma
To co-render ![]() seismic
seismic![]() attributes means to blend two or more
attributes means to blend two or more ![]() seismic
seismic![]() attributes into a single, unified
attributes into a single, unified ![]() data
data![]() display. As a result of efforts to demonstrate the value of volumetric interpretation of
display. As a result of efforts to demonstrate the value of volumetric interpretation of ![]() seismic
seismic![]()
![]() data
data![]() , most modern software allows interpretation on time or horizon slices, together with geobody detection and multi-volume and multi-attribute co-rendering. Advanced display technology and visualization systems accelerate the interpretation process, create expanded insights into prospects and provide new means of communicating these insights to co-workers, management, partners and investors.
, most modern software allows interpretation on time or horizon slices, together with geobody detection and multi-volume and multi-attribute co-rendering. Advanced display technology and visualization systems accelerate the interpretation process, create expanded insights into prospects and provide new means of communicating these insights to co-workers, management, partners and investors.
|
|
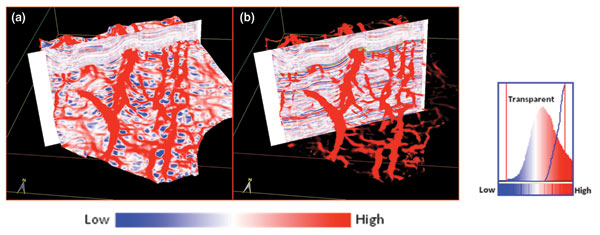
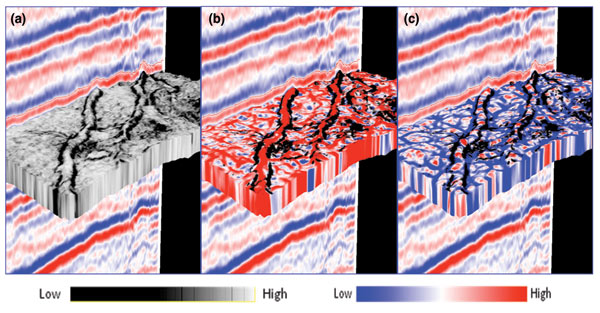
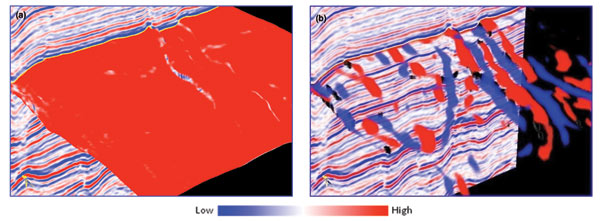
A false-color technique used to co-render
From experiences of mixing paints, most people know how these three colors blend, which makes this RGB technique a powerful In the simplest implementation of RGB co-rendering, each voxel in Volume rendering consists of controlling the color and opacity of each voxel and projecting these properties onto an image plane. Such volume rendering allows interpreters to see and interact with features inside the In Figure 1a we show a strat- In Figure 2a we show a chair view of a vertical slice through a Next we show the equivalent chair view, but with most-positive principal curvature (Figure 2b) and most-negative principal curvature (Figure 2c) co-rendered with coherence. Only very low values of coherence have been retained. High and intermediate coherence values have been made transparent. Note that the edges of the channels are again well-defined on the coherence surface. The channels appear as trends in which most-positive curvatures have their maximum positive values. Our tentative interpretation is that these are two sand-prone channels incised in a shale matrix that has undergone differential compaction. Consistent with this interpretation, the most-negative curvature anomalies define the edges of the channels (Figure 2c). In Figure 3a we show an inline vertical slice and a phantom horizon slice 8 ms below an interpreted zero crossing. In Figure 3b we show an equivalent chair view where the phantom horizon slice is correlated with most-positive and most-negative curvature volumes. Using transparency, we have retained only the higher positive values of most-positive curvature and the lowest negative values of most-negative curvatures. This co-rendered display shows red lineaments associated with the upthrown sides of the faults and blue lineaments associated with downthrown sides. Such displays convey more information than do strat-
Copyright © AAPG. Serial rights given by author. For all other rights contact author directly. |
 General statement