![]() Click to view article in PDF format.
Click to view article in PDF format.
GCEstimating Seafloor Strength with C4 Data*
Bob Hardage1
Search and Discovery Article #40792 (2011)
Posted September 19, 2011
*Adapted from the Geophysical Corner column, prepared by the author, in AAPG Explorer, September, 2011, and entitled “Deep Thinking: 4C Proves Value on Seafloor”. Editor of Geophysical Corner is Bob A. Hardage ([email protected]). Managing Editor of AAPG Explorer is Vern Stefanic; Larry Nation is Communications Director.
1 Bureau of Economic Geology, The University of Texas at Austin ([email protected])
Marine 4C seismic technology was developed to assist hydrocarbon exploration and development – but 4C data have important marine engineering applications that have not been exploited. The data discussed here illustrate how 4C data can be used to define geomechanical properties of a seafloor where engineers need to install production facilities.
Emphasis is placed here on determining bulk moduli and shear moduli of seafloor sediment. Bulk modulus, K, for a homogeneous medium is given by the equation:
K = [(VP)² – (4/3)(VS)²]
Shear modulus, μ, for the same homogeneous material is defined by:
μ = (VS)².
In these expressions, VP and VS are, respectively, P-wave and S-wave velocities in seafloor sediment, and is the bulk density of a sediment sample.
|
|
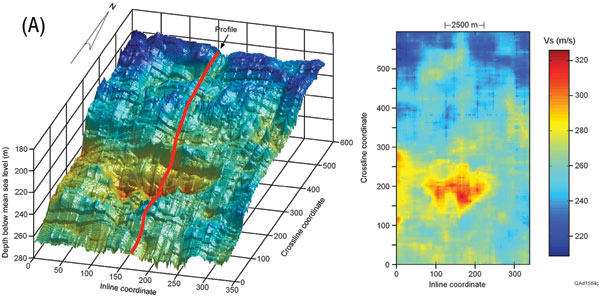
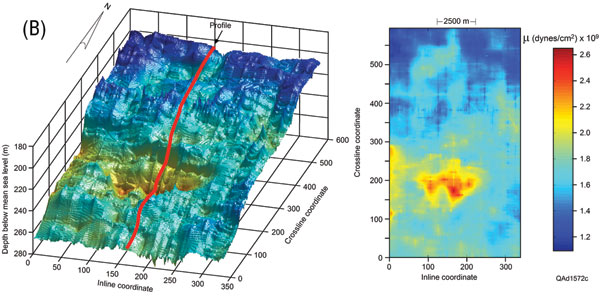
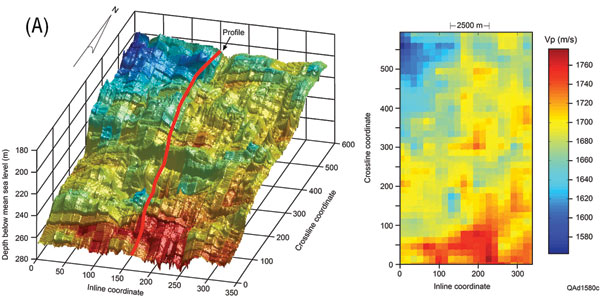
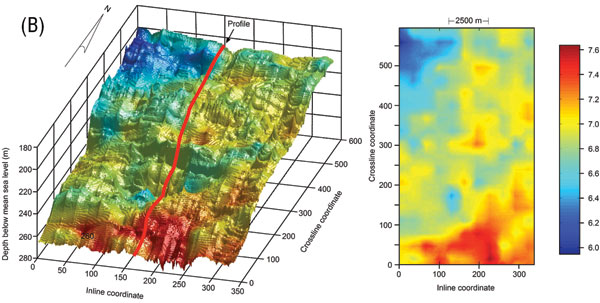
Figure 1 presents shallow data windows of compressional (P-P) and converted-shear (P-SV) profiles across an area of 4C/3D data acquisition. Data The profile crosses a gas-invaded zone centered on crossline coordinate 200. P-P horizons H1 through H4 are interpreted to be depth-equivalent surface to P-SV horizons H1 through H4. For simplicity, the bulk density term in the two equations above is assumed to have a constant value of 1.8 gm/cm³ across the data Figure 2 displays seismic-derived VP velocities and calculated bulk moduli across the shallowest seafloor layer (WB to H4), and seismic-derived VS velocities and shear moduli values calculated for the layer are shown on Figure 3. Each elastic constant is shown as a Referring to equation 2, it is no surprise that VS and μ have a one-to-one correlation. The one-to-one relationship between VP and K is caused by the fact VP is much larger than VS within this shallowest seafloor layer. In areas having hard seafloor sediment and for deeper layers where the VP/VS ratio has values appropriate for consolidated rocks, the VS term of equation 1 will be significant, and there will not be such a close correlation between K and VP. The multicomponent seismic data application illustrated by this example can be done more rigorously by implementing a data-point by data-point inversion to create thin VP and VS layers that provide greater detail about zones of mechanical weakness. The intent of this example is only to document that even simple
Copyright © AAPG. Serial rights given by author. For all other rights contact author directly. |
 General statement