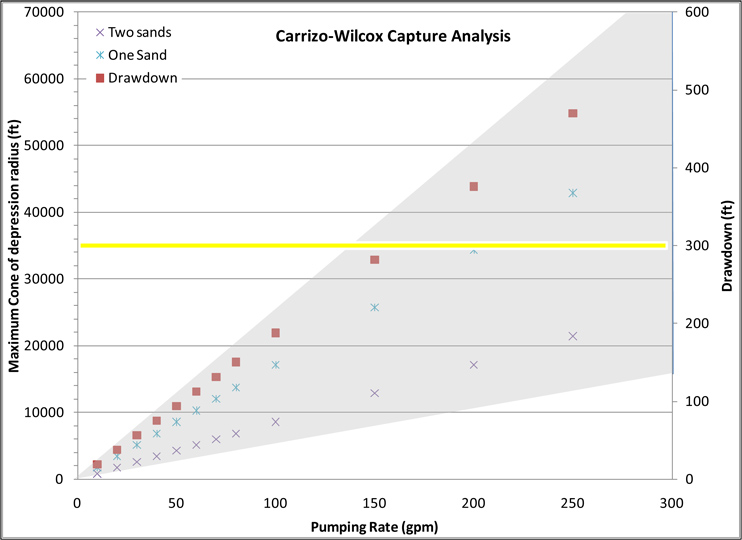
Figure 4. Capture zone analysis for the CWA, depicting the maximum zone of influence and well drawdown per pumping rate. The yellow
line represents the base of freshwater for most of southern Caddo Parish. The gray shadow represents the range in K values (5.2 and 12.5 ft/day).