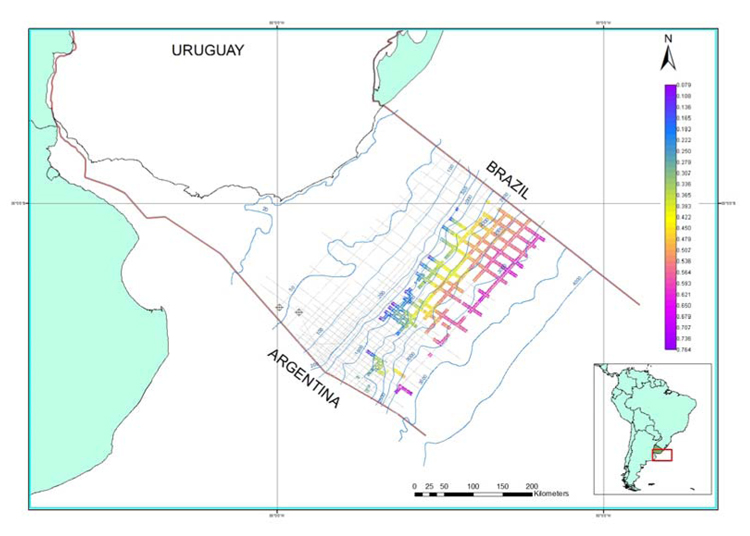
Figure 4. Distribution of the BSR and bathymetry offshore Uruguay. The color scale shows the depth of the base of the GHSZ from the seafloor in seconds (TWT).
Figure 4. Distribution of the BSR and bathymetry offshore Uruguay. The color scale shows the depth of the base of the GHSZ from the seafloor in seconds (TWT).