Click to view article in PDF format.
GCThe Balance between Geophysics and Geology in Seismic Interpretation*
Search and Discovery Article #40616 (2010)
Posted October 22, 2010
*Adapted from the Geophysical Corner column, prepared by the author and entitled "Balance between G&G is Critical," in AAPG Explorer, December, 2005. Appreciation is expressed to Alistair Brown, editor of Geophysical Corner, and to Larry Nation, AAPG Communications Director, for their support of this online version.
![]() 1
1![]() Consulting reservoir geophysicist, Dallas, TX ([email protected])
Consulting reservoir geophysicist, Dallas, TX ([email protected])
Everyone is a product of his/her own experience. Hence geophysicists tend to favor geophysical methods and geologists tend to favor geological methods. It is only natural. However, we all know that the search for and development of oil and gas involves both disciplines. We all need to be geoscientists. We all need to meld geophysics and geology in an effective manner. We need to be integrated. I regularly have cause to admonish a course student of mine for "over-geologizing" the solution. He or she imposes a geological concept or model on the seismic interpretation rather than "letting the data speak." The majority of seismic interpreters come from a geological background, so they have to learn the intricacies of geophysics. With modern 3-D data there is a lot more to learn than there used to be. We have to appreciate the value of seismic amplitude, the resolution of the data, how to recognize data defects, the precision of workstation autotrackers, the complexities of seismic horizon identification, and the mystifying plethora of seismic attributes.
|
|
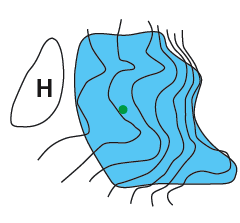
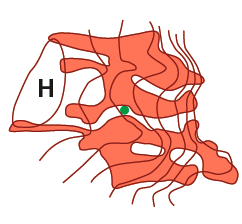
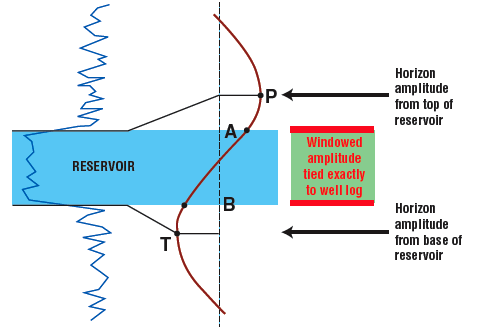
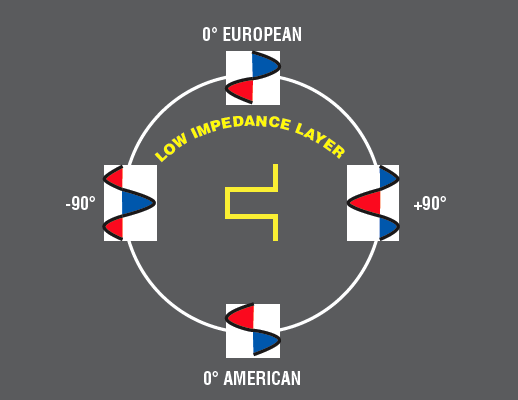
Example In a prospect in Latin America, a high amplitude was identified as a turbidite sand that had been recognized in a nearby well. The amplitude was mapped manually to indicate a prospective area of useful size. The geologically oriented interpreter made the map look like a turbidite because he had seen one before (Figure A more detailed geophysically oriented analysis of the high amplitude was then undertaken. All the data were used, the tracking was performed with a high-precision autotracker, and the horizon amplitude was extracted to produce a horizon slice. A simplified version of this is shown in Figure 2. Note that the initially proposed drilling location is now found to be in a local amplitude low, indicating that the turbidite sand here is thin or absent. Clearly the well needs to be relocated, as we believe that amplitude is a measure of porosity-thickness. Many seismic interpreters take a formation top on a log, measured in depth, convert it to time and pick at that exact position on the seismic section. A simple synthetic seismogram constructed from a sonic log using a Ricker wavelet may be used as an aid. These conventional approaches neglect errors caused by seismic velocity, hole conditions, tuning effects, data phase and data polarity. All these issues, and others, make the seismic-to-well tie quite complicated. The velocity function normally comes from a well velocity survey or a vertical seismic profile in the well being tied or in a nearby well. Errors of measurement and lateral variations mean that the velocity used is rarely exactly correct. The phase and the polarity of the data are significant uncertainties, but first let us consider that the data really are zero phase and of known polarity. The reservoir we wish to study in this example has good contrast at top and base; therefore, tying the well should be simple. If the reservoir is less than quarter-wavelength in thickness (as they so often are), the reflections from top and base cannot get close enough together so that they are both mislocated (Figure 3). The top reflection is early and the base reflection is late. The diagram in Figure 3 is drawn for perfect velocity, but we still do not use a simple depth-to-time tie to pick the top of the reservoir on the seismic data. An understanding of tuning effects tells us we must pick the reservoir top at point P rather than point A. This is not only geophysically correct, but point P is where the amplitude is to be found for studying the internal fabric of the reservoir. The other relevant amplitude for studying this reservoir is from the base reflection at point T. Let me give an example of how we could over-geologize the interpretation here. We want an amplitude to characterize this reservoir, and we have accurate picks on the top and base of the sand. We spot the top and base on the seismic, A and B as shown, and then extract a windowed amplitude such as Average Absolute Amplitude or RMS Amplitude over this interval. Note that the window, which exactly ties the reservoir, completely misses the two relevant amplitudes from top and base! The best amplitude to characterize this reservoir is Composite Amplitude, made by absolute value summation of the horizon amplitudes from P and T. This tie is further complicated by data phase and polarity. Interpreters should not rely on nominal zero phase data being actually zero phase. Nor should they rely on the data polarity being "normal" for the region of the world where they are located (American or European). We should check these out by scrutinizing the character of high amplitude reflections whose geological nature we understand. It is the responsibility of every seismic interpreter today to assess as thoroughly as possible the phase and polarity of his or her data before a final well-to-seismic tie is established. Suppose the high amplitude reflections being used are a gas bright spot. The sand generating the bright spot must then be a low impedance zone relative to the embedding shale, so the relevant phase circle is shown in Figure 4. Note that we are considering top and base reflections together. Note also that there are two versions of zero phase (American and European polarity), which are opposite from each other. These are equally useful for interpretation, but it is critical to understand which we have. The issue is further complicated by the all-too-common 90-degree phase data. Other phase conditions also exist. Knowledge of phase and polarity permits us to predict the character of the reservoir top (for example) and thus to make a meaningful well tie. If the determined phase is significantly non-zero, then phase rotation of the data is probably a good idea. Phase rotation is easy; recognition of phase errors by today's seismic interpreters is more difficult. Zero-phase data are the easiest to work with, and the co-location of time and amplitude is a big advantage.
Copyright © AAPG. Serial rights given by author. For all other rights contact author directly. |