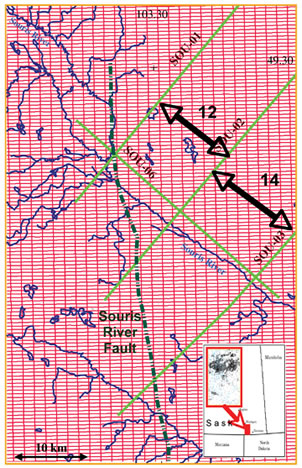
Figure 1. Index map for project, with the study area shown in red (inset). The inner inset shows the distribution of wells in the area, including the Weyburn Field. The red lines show the HRAM data (500 x 1500m line spacing), and the light green lines show the 2-D seismic data being correlated. The drainage is shown in blue and the interpreted Souris River Fault is shown as a dark green dashed line.