Click to view article in PDF format.
Bob Hardage1
Search and Discovery Article #40503 (2010)
Posted January 19, 2010
*Adapted from the Geophysical Corner column, prepared by the author, in AAPG Explorer, January, 2010, and entitled “Vertical ![]() Wave
Wave![]() Testing: Part 2”. Editor of Geophysical Corner is Bob A. Hardage
([email protected]). Managing Editor of AAPG Explorer is Vern Stefanic;
Larry Nation is Communications Director. Please refer to closely related article by Horizontal
Testing: Part 2”. Editor of Geophysical Corner is Bob A. Hardage
([email protected]). Managing Editor of AAPG Explorer is Vern Stefanic;
Larry Nation is Communications Director. Please refer to closely related article by Horizontal ![]() Wave
Wave![]() Testing, Search and Discovery article #40502.
Testing, Search and Discovery article #40502.
1 Bureau of Economic Geology, The University of Texas at Austin ([email protected])
Vertical ![]() wave
wave![]() testing is done by deploying seismic receivers downhole and recording the downgoing wavelet generated by each energy source being considered for surface seismic data acquisition across the area local to the receiver well. The objectives of a vertical
testing is done by deploying seismic receivers downhole and recording the downgoing wavelet generated by each energy source being considered for surface seismic data acquisition across the area local to the receiver well. The objectives of a vertical ![]() wave
wave![]() test are to determine the frequency bandwidth of the downgoing wavelet that illuminates subsurface geology, and to observe how the energy and frequency content of that wavelet diminishes as the wavelet propagates through stratigraphic intervals that need to be imaged with surface-based seismic data. Vertical
test are to determine the frequency bandwidth of the downgoing wavelet that illuminates subsurface geology, and to observe how the energy and frequency content of that wavelet diminishes as the wavelet propagates through stratigraphic intervals that need to be imaged with surface-based seismic data. Vertical ![]() wave
wave![]() testing is a rigorous technique that allows geophysicists to decide which seismic source is optimal for imaging specific sub-surface geology.
testing is a rigorous technique that allows geophysicists to decide which seismic source is optimal for imaging specific sub-surface geology.
One limitation is that the data provide information that helps only in selecting the seismic source that will be used across
a prospect. The technique does not provide information that helps in designing surface-based receiver arrays. Horizontal
![]() wave
wave![]() testing, described in Search and Discovery Article #40502, has to be done to determine appropriate surface-receiver array dimensions.
testing, described in Search and Discovery Article #40502, has to be done to determine appropriate surface-receiver array dimensions.
|
|
Vertical
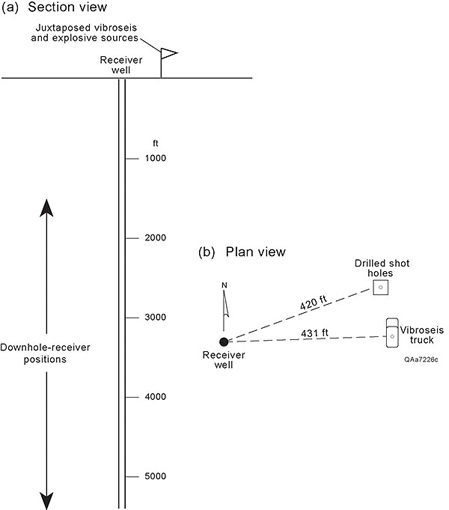
The source-receiver geometry used for vertical
A vertical
An example of The small directional-charge source option was selected for acquiring 3-D seismic data across this prospect because a significant part of the survey area was covered by dense timber that made vibrator operations difficult and expensive (due to timber clearing). However, small drill rigs could wend through the trees and drill shallow holes for deploying explosives without the necessity of clearing any timber for vehicle movement, resulting in more affordable data acquisition. The frequency content of the explosive-source and vibrator-source test data is exhibited as Figure 3. The frequency spectrum of the explosive source wavelet measured at a depth of 2,000 feet (600 meters) extends to 200 Hz – and at a depth of 5,000 feet (1,500 meters) there is still appreciable energy at frequencies as high as 180 Hz (Figure 3a). The vibrator sweep of 6 to 160 Hz results in a frequency spectrum that exhibits an abrupt onset of energy near 8 Hz and an abrupt energy decrease at 160 Hz at all receiver depths (Figure 3b). These data supported the decision to use small directional explosives as the seismic source at this prospect. To increase the signal-to-noise ratio of the surface-recorded data, three shot holes, each having a 10-ounce (280-gram) directional charge, were shot simultaneously to increase the amplitude of the downgoing wavelet.
Results from a second vertical
The message: Always execute a vertical
Copyright © AAPG. Serial rights given by author. For all other rights contact author directly. |