--> Horizontal Wave Testing, by Bob Hardage, #40502 (2010).
[First Hit]

Datapages, Inc.Print this page

Click to view article in PDF format.


GCHorizontal Wave Testing*


Bob Hardage1


Search and Discovery Article #40502 (2010)

Posted January 19, 2010


*Adapted from the Geophysical Corner column, prepared by the author, in AAPG Explorer, December, 2009, and entitled “Horizontal Wave Testing Helps”. Editor of Geophysical Corner is Bob A. Hardage ([email protected]). Managing Editor of AAPG Explorer is Vern Stefanic; Larry Nation is Communications Director. Please refer to closely related article by Bob Hardage, 2010, Vertical Wave Testing, Search and Discovery article #40503.


1 Bureau of Economic Geology, The University of Texas at Austin ([email protected])


General statement

Collecting optimal quality seismic Previous HitdataNext Hit across some onshore prospects can be a challenge for numerous reasons:

  • Near-surface conditions may produce strong refraction noise.
  • Ambient noise may exist because of local culture.
  • Different energy sources, such as shot hole explosives, vibrators and impulsive impactors, need to be considered.
  • Several receiver-patch dimensions should be evaluated for effectiveness.

Because of these factors, a source that produces good-quality Previous HitdataNext Hit across a sandy-soil grassland may produce poor Previous HitdataNext Hit across an area of hard rock outcrops, and a receiver dimension that cancels ground-roll noise at prospect A may fail to do so at prospect B. Before a seismic Previous HitdataNext Hit-acquisition effort is launched across a prospect, seismic test Previous HitdataNext Hit need to be acquired to determine:

  • The type of energy source.
  • The dimension of the receiver patch.
  • The specific source-receiver geometry that will yield Previous HitdataNext Hit with appropriate signal bandwidth and signal-to-noise character.

The effort expended in acquiring this basic planning information is commonly referred to as wave testing or noise testing.


uGeneral statement

uFigures

uMethodology

uPrevious HitExampleNext Hit

uConclusions


uGeneral statement

uFigures

uMethodology

uPrevious HitExampleNext Hit

uConclusions


uGeneral statement

uFigures

uMethodology

uPrevious HitExampleNext Hit

uConclusions


uGeneral statement

uFigures

uMethodology

uPrevious HitExampleNext Hit

uConclusions


uGeneral statement

uFigures

uMethodology

uPrevious HitExampleNext Hit

uConclusions


Figure Captions

Figure 1. Source-receiver geometry employed when recording seismic wave-test Previous HitdataNext Hit. The distance “X” from source point SP1 to source point SPN should equal or exceed the depth to the deepest target that needs to be imaged. Distance “L” between successive source stations is the same as the length of the stationary geophone spread. The separation “d” between successive geophones stations should be small (two to three meters), and the receiver-patch length L needs to be reasonably long (200 to 400 meters).

Figure 2. Wave-test Previous HitdataNext Hit recorded for the purpose of analyzing signal frequency bandwidth, identifying coherent and ambient noise modes and quantifying signal-to-noise character of seismic Previous HitdataNext Hit across a prospect area. In this Previous HitexampleNext Hit, closely spaced test-Previous HitdataNext Hit traces have been summed to represent Previous HitdataNext Hit acquired with a geophone array length of 110 feet (33.5 meters). The apparent velocities of several modes embedded in the test Previous HitdataNext Hit are labeled in units of feet/second.

Figure 3. Wave-test Previous HitdataNext Hit acquired with d = 20 feet (six meters) after a 12-Hz low-cut filter is applied and a running sum of 11 adjacent traces is calculated to simulate Previous HitdataNext Hit that would be acquired with an inline receiver array spanning 220 feet (67 meters). Hard evidence now has been produced that defines the receiver patch dimension (220 feet) that should be used at each receiver station to optimize Previous HitdataNext Hit quality.

Figure 4. Seismic frequency (vertical axis) and wavelength (horizontal axis) information embedded in the Previous HitdataNext Hit window labeled Transform window on Figure 3. This Previous HitdataNext Hit analysis shows that if production seismic Previous HitdataNext Hit are acquired at this test site with a 220-foot receiver array (Figure 3), the frequency bandwidth should span approximately 80 Hz and each Previous HitfieldNext Hit record should be dominated by high-velocity reflection signals (events labeled Reflector 1 and Reflector 2). The format used to exhibit this frequency-wavelength information on a black/white printer shows how geophysicists had to display Previous HitdataNext Hit analyses in the Previous HitfieldNext Hit in olden days before color plotters were Previous HitfieldNext Hit portable.

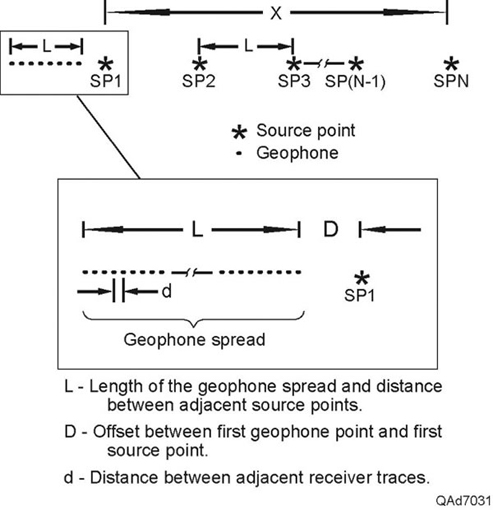
Horizontal Wave Test Methodology

Seismic wave-test Previous HitdataNext Hit are usually acquired using a “walkaway,” or moving source geometry, such as illustrated on Figure 1. When recording the Previous HitdataNext Hit, the receiver spread remains stationary and source stations are moved away from the receiver patch at distance increments L that equal the receiver spread length. The maximum source-to-receiver offset distance X should equal or exceed the depth to the deepest target that needs to be imaged with the surface-recorded seismic Previous HitdataNext Hit. Each receiver station within the receiver patch should be occupied by a single geophone – not by a string of geophones that extend over an appreciable distance – which prevents the cancellation of short-wavelength energy modes that need to be analyzed. There should be no skipped source stations along the line of profile.

If a source station is inaccessible for any reason, that source point should be moved closer to the receiver spread to prevent gaps in the offset profile. Successive source stations should then be moved forward by the same distance to preserve a uniform spacing L between the remaining source-station positions.

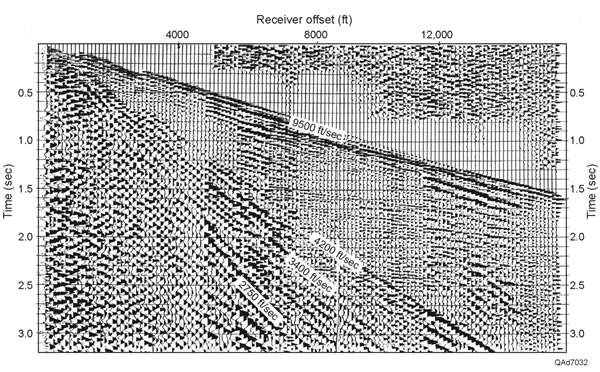
Site selection is important when recording wave-test Previous HitdataNext Hit because the Previous HitdataNext Hit sample only a small portion of a prospect. A wave-test site should be representative of the entire prospect. If surface conditions change over a prospect, more than one wave-test site should be considered.

Previous HitExampleNext Hit

Wave-test Previous HitdataNext Hit acquired across one prospect area circa 1975, using a recording geometry such as described on Figure 1, are illustrated on Figure 2. These Previous HitdataNext Hit illustrate several coherent noise modes. The dominant noises are a refraction event that has an apparent velocity of 9,500 feet/second (2,900 meters/second) and a band of surface waves with apparent velocities ranging from 2,750 to 4,200 ft/s (825 to 1,280 m/s).

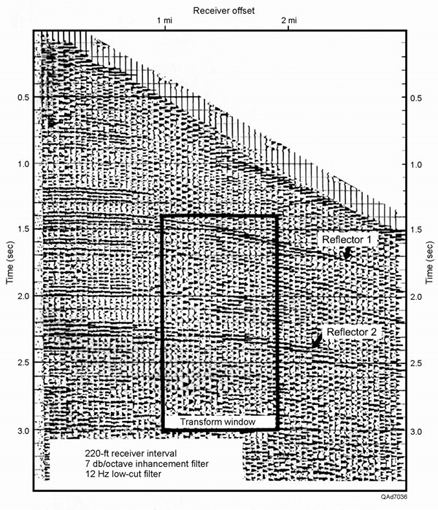
Several reflection events can be seen between 1.5 and 2.5 s at large offset distances beyond the surface-wave noise cone. Because wave-test Previous HitdataNext Hit are acquired using a small trace spacing d, any arbitrary-length inline receiver array can be simulated by summing an appropriate number of adjacent traces. For Previous HitexampleNext Hit, the Previous HitdataNext Hit on Figure 3 show the effect of adding 11 consecutive traces of wave-test Previous HitdataNext Hit acquired with a geophone spacing d = 20 feet (Figure 1) to simulate Previous HitdataNext Hit that would be acquired with a string of geophones spanning 220 feet (67 meters) at each offset station.

A 12-Hz low-cut filter has been applied to these Previous HitdataNext Hit to aid in reducing low-frequency noise. The frequency and wavelength content of the Previous HitdataNext Hit inside the indicated Transform window is illustrated on Figure 4 and confirms that the Previous HitdataNext Hit are dominated by high-velocity reflection signals. Running sums can be made using different numbers of test-Previous HitdataNext Hit traces to simulate how receiver groups spanning any desired distance affect the frequency content and signal-to-noise ratio of prospect Previous HitdataNext Hit.

Conclusions

With this knowledge, seismic contractors can deploy receiver groups that have dimensions that will produce optimal quality Previous HitdataNext Hit when production Previous HitdataNext Hit recording is done. Similarly, different sources can be deployed at each source station SP1 to SPN (Figure 1) to compare Previous HitdataNext Hit quality produced by vibrators versus impactors or by small explosive charges deployed at shallow depth versus large explosive charges placed at deep depths. By comparing Previous HitdataNext Hit quality generated by each source option, a contractor will know the best source to use across a specific prospect.

The concept described here should really be called horizontal wave testing, meaning geophones are deployed horizontally across the Earth surface when acquiring the test Previous HitdataNext Hit. In Search and Discovery Article #40503 we will consider the concept of vertical wave testing, where geophones are deployed vertically in a deep well as test Previous HitdataTop are acquired.


Return to top.


Copyright © AAPG. Serial rights given by author. For all other rights contact author directly.