![]() Click to view article in PDF format.
Click to view article in PDF format.
Pioneering the Global Subsalt/Presalt Play: The World Beyond Mahogany Field*
Dwight "Clint" Moore1
Search and Discovery Article #10285 (2010)
Posted December 17, 2010
1ION Geophysical Corp., Houston, TX ([email protected])
*Adapted from presentation at: AAPG Annual Conference and Exhibition, New Orleans, Louisiana, April 11-14, 2010, AAPG International Conference, Rio de Janeiro, Brazil, November, 15-18, 2009, Houston Geological Society General Meeting, March, 2010, New Orleans Geological Society, General Meeting, July, 2010, Oklahoma Geological Foundation, Cronin Lecture, November, 2009.
Ten years into the 21st century, the Subsalt play that began in the U.S. offshore Gulf of Mexico during the 1980’s, has evolved into a growing global Subsalt/Presalt play, of likely historic impact. Today, we are at the dawn of major reserve and production additions to the world oil & gas supply, as global Subsalt/Presalt petroleum exploration yields major results, not only in the Gulf of Mexico, but also off Brazil and West Africa. In the years ahead, these new discoveries will fuel further exploration & production below complex salt layers worldwide.
Since its inception, the greatest challenge for the Subsalt/Presalt play concept has been explorers’ difficulty in using seismic data to accurately image the subsurface below and around salt, in order to identify structures to drill. As a result of recent major advances in seismic processing algorithms & computer processing speeds, explorers’ can now see Subsalt/Presalt images much more clearly. The most progressive are applying these latest technologies to more salt basins globally.
Reverse Time Migration (RTM) represents the most recent and significant advance in seismic imaging below salt layers. Propelled by advances in workflows, computing power, and data management, RTM now provides the most accurate view of Subsalt/Presalt prospects, discoveries, and fields. In addition, improved seismic acquisition technology utilizing longer seismic cable lengths and denser, larger data volume collection programs, such as wide-azimuth (WAZ) and multi-azimuth (MAZ) geometries, provide extensive data volumes for the application of advanced RTM technology. Without accurate seismic imaging technology, the drilling and development of prospects is much riskier and more expensive than desired.
Discovery and development of Subsalt/Presalt fields found in past decades, using less-advanced pre-stack depth imaging applied to short-offset 2-D and narrow azimuth 3-D seismic surveys, has discovered significant reserves and production, but represents a fraction of the potential that will likely be globally discovered using new RTM technology. As was learned in the early years of exploring subsalt in the US Gulf of Mexico, we must accurately image below the salt layers, in order to have sufficient success rates to justify future economic investment. There are now fewer limits on the future global oil & gas potential below salt, and the likely discovery of substantial oil & gas reserves and production for the world of tomorrow.
Copyright © AAPG. Serial rights given by author. For all other rights contact author directly.
|
|
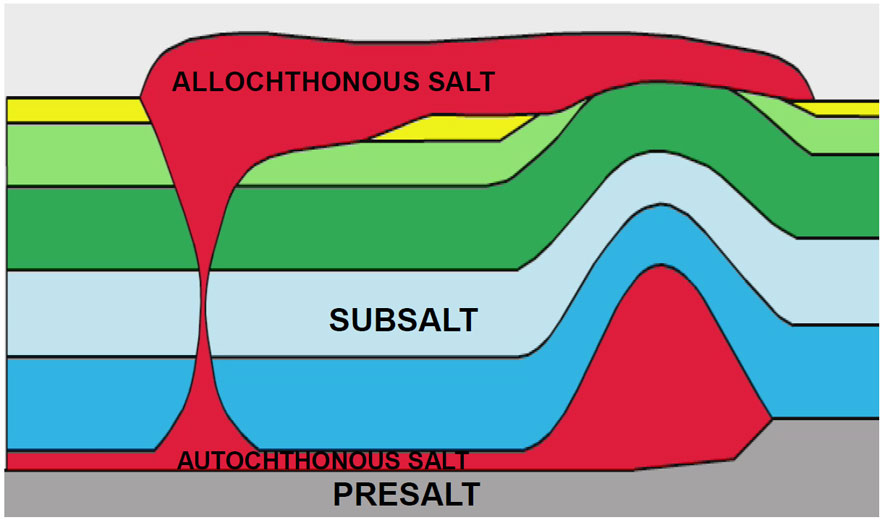
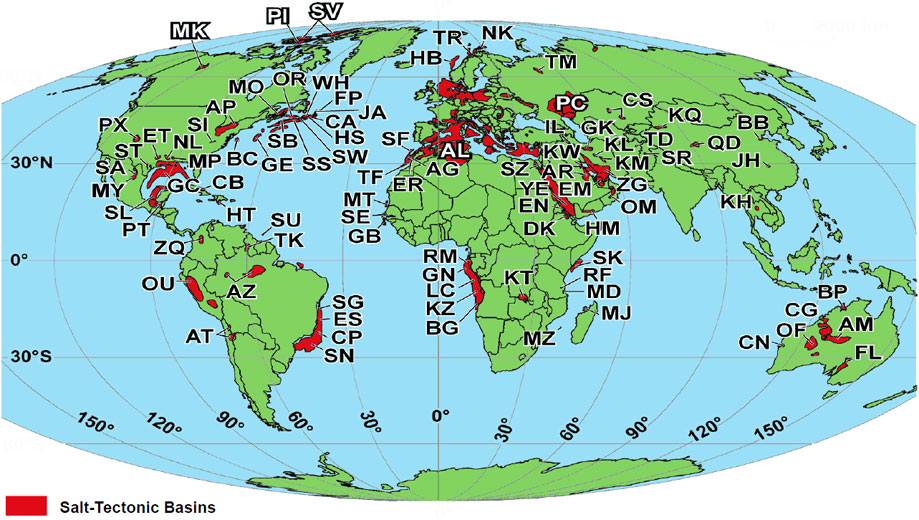
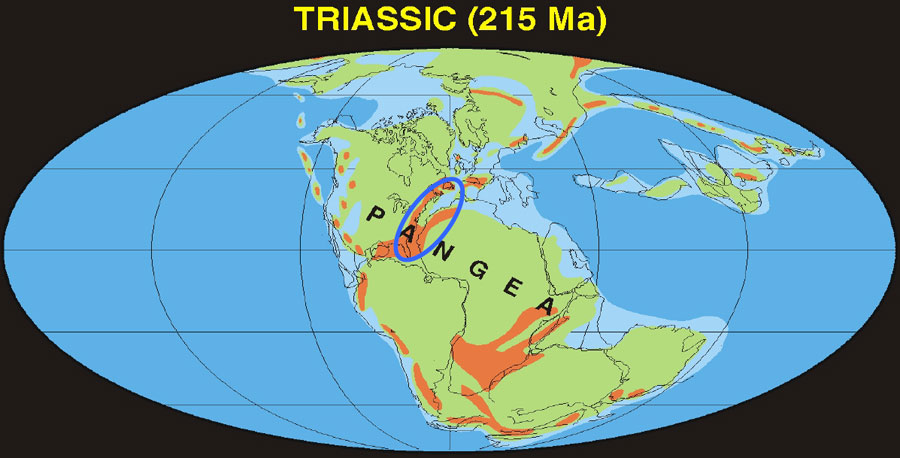
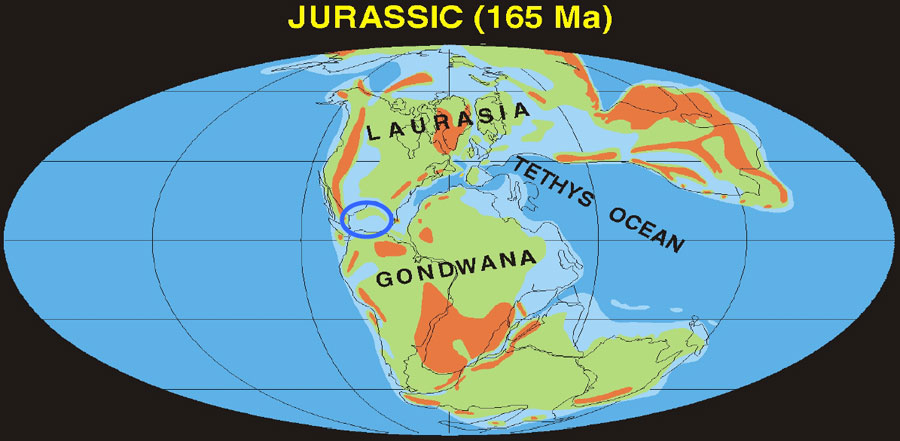
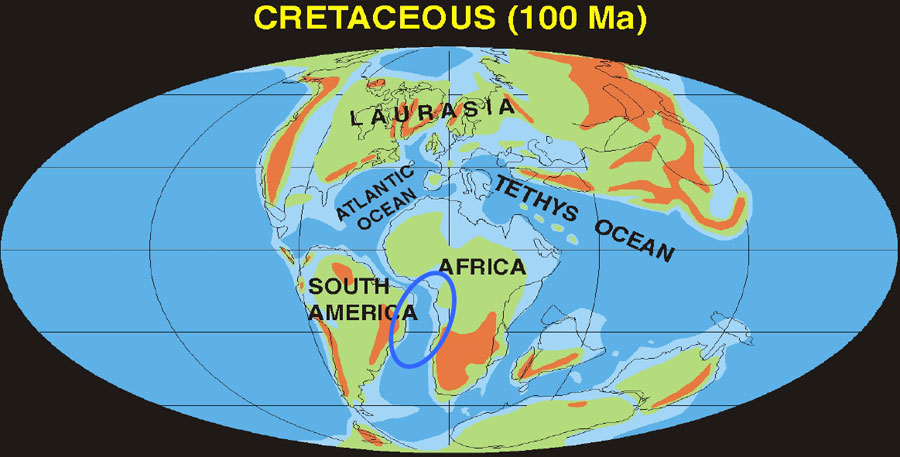
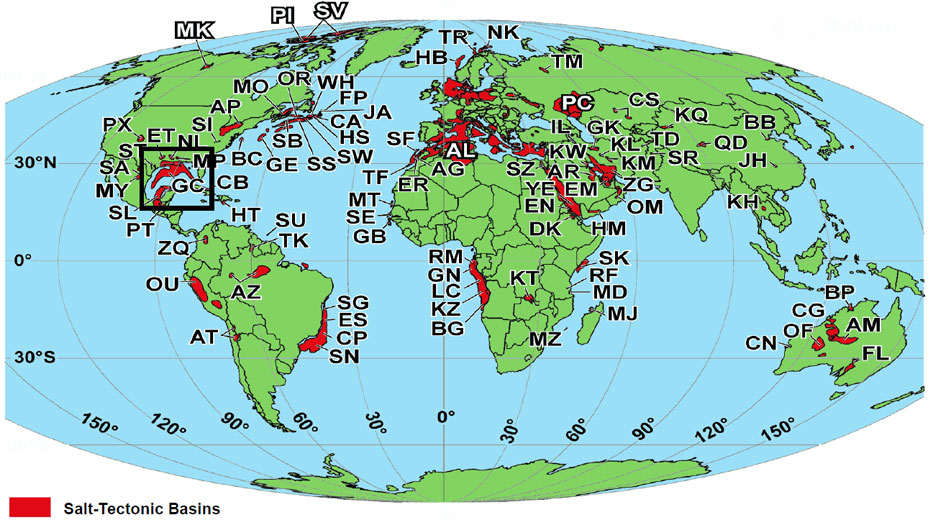
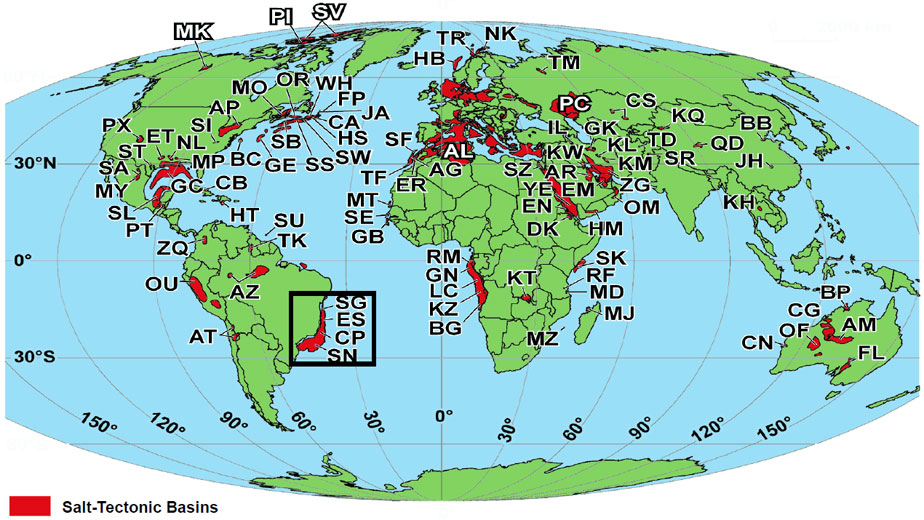
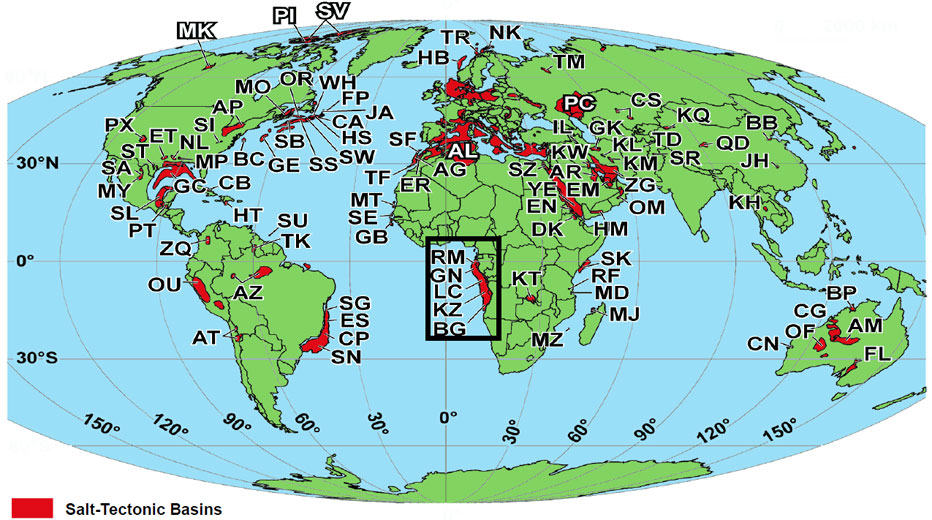
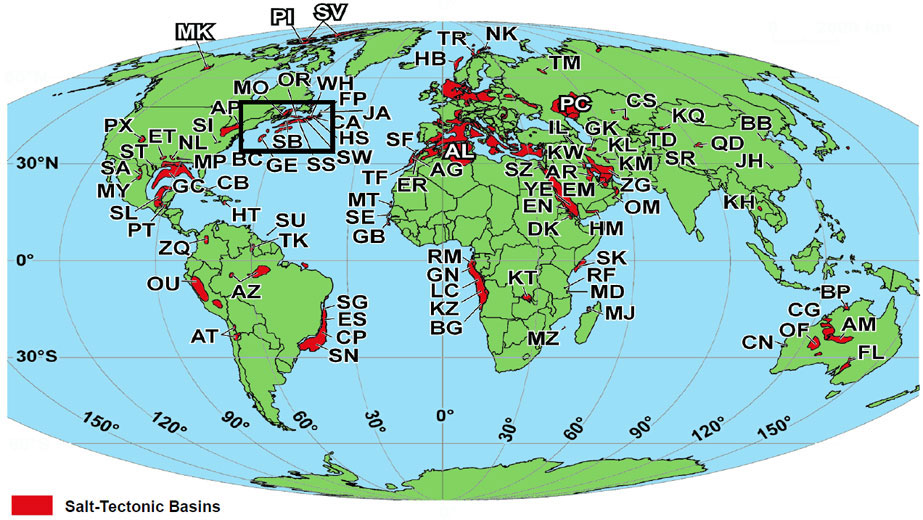
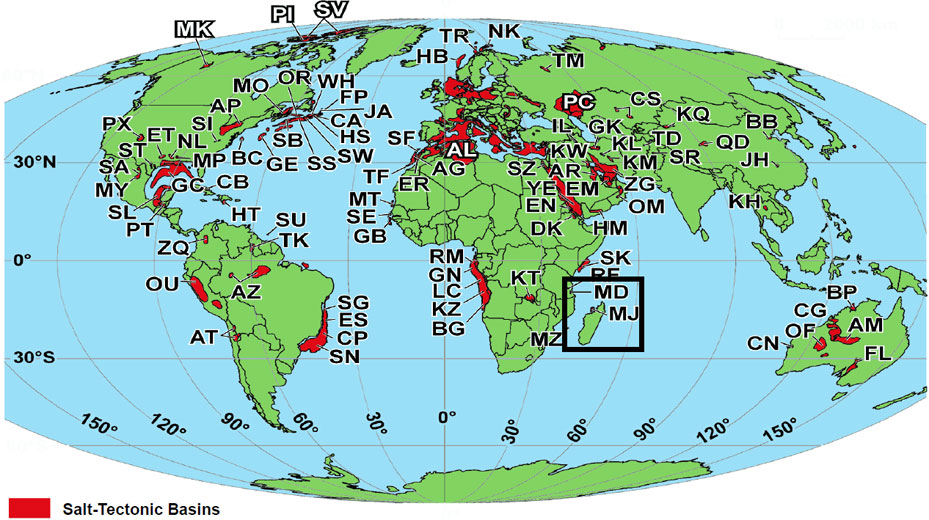
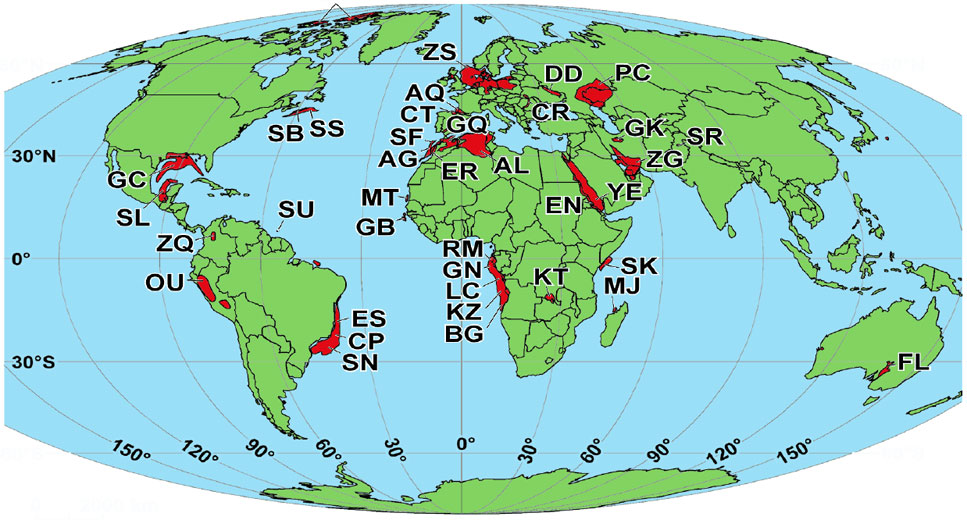
From the Past into the Future “Several times in the past we have thought we were running out of oil whereas actually we were only running out of ideas.” Geology Professor Parke A. Dickey, 1958. “Discovery consists of seeing what everybody has seen, and thinking what nobody else has thought.” Albert Szent-Gyorgyi (1893-1986) Nobel Prize in Medicine (1937) -Discoverer of Vitamin C Subsalt vs. Presalt Subsalt –exploring beneath an allochthonous salt layer that overlies stratigraphically younger rock. Presalt–exploring beneath an autochthonous salt layer that overlies stratigraphically older rock. Worldwide there are more than 100 salt tectonic basins (Figure 2); paleogeographic settings during the Mesozoic are instructive for considering those basins in the Western Hemisphere and sub-Saharan Africa (Figures 3, 4, 5, and 6).
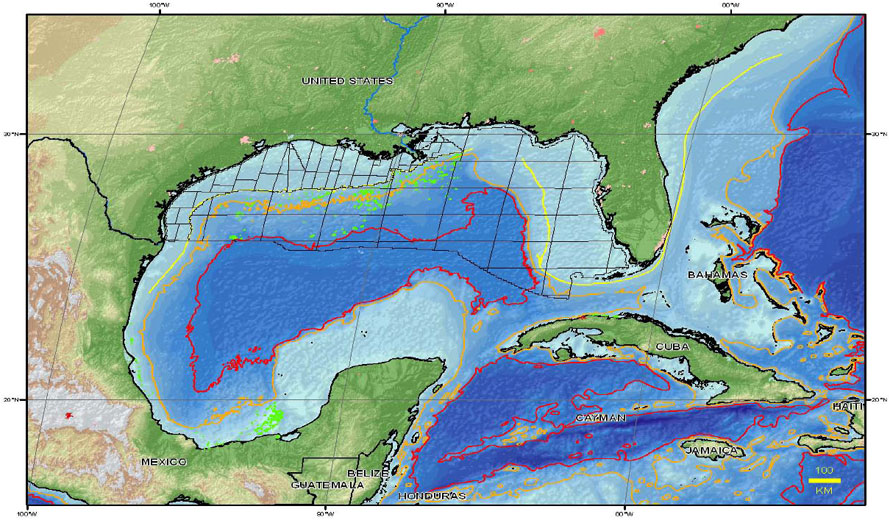
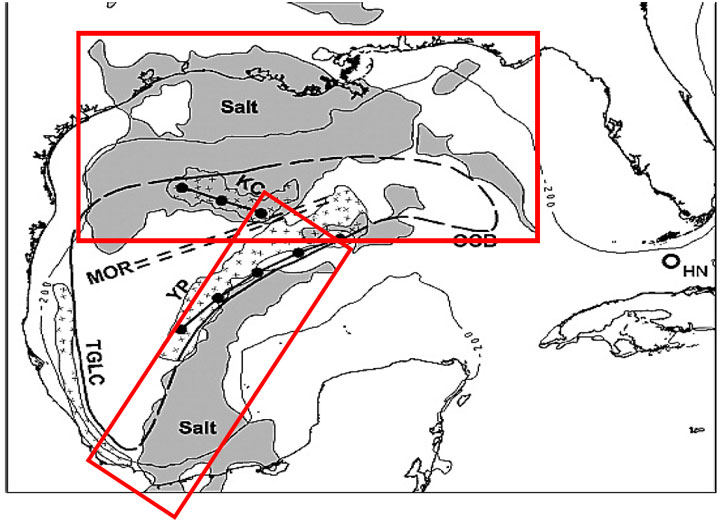
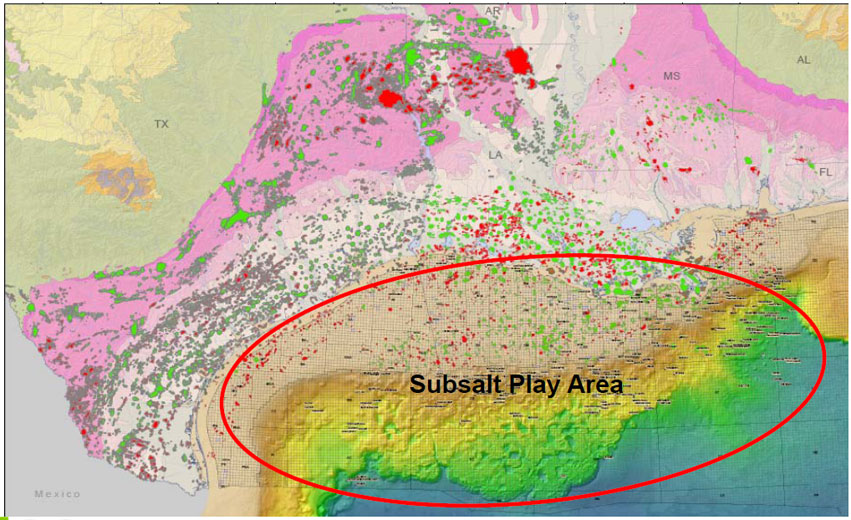
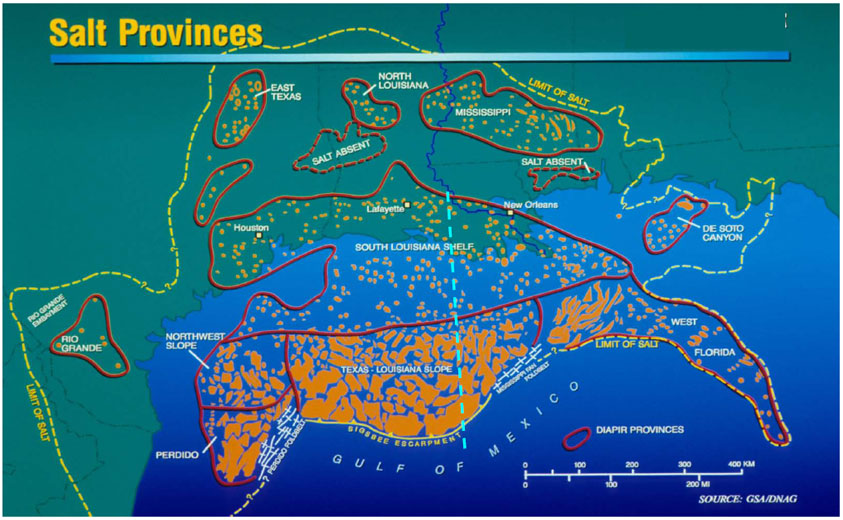
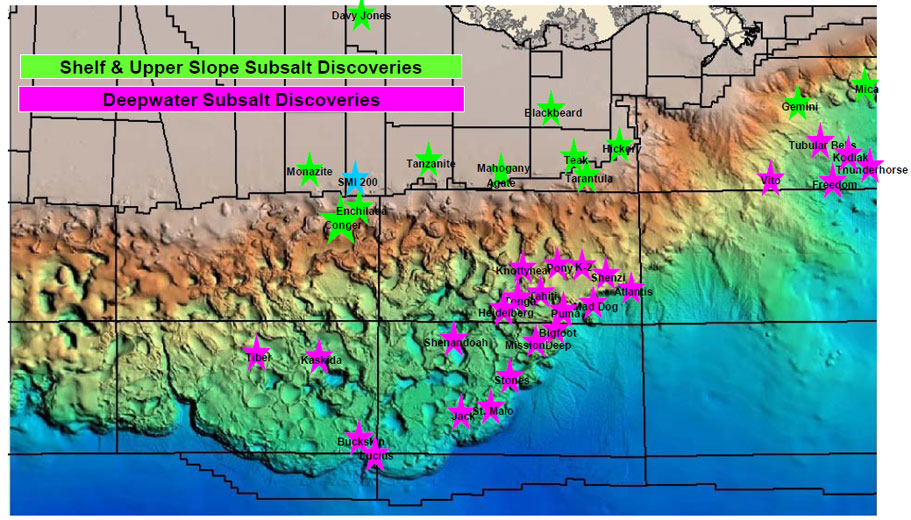
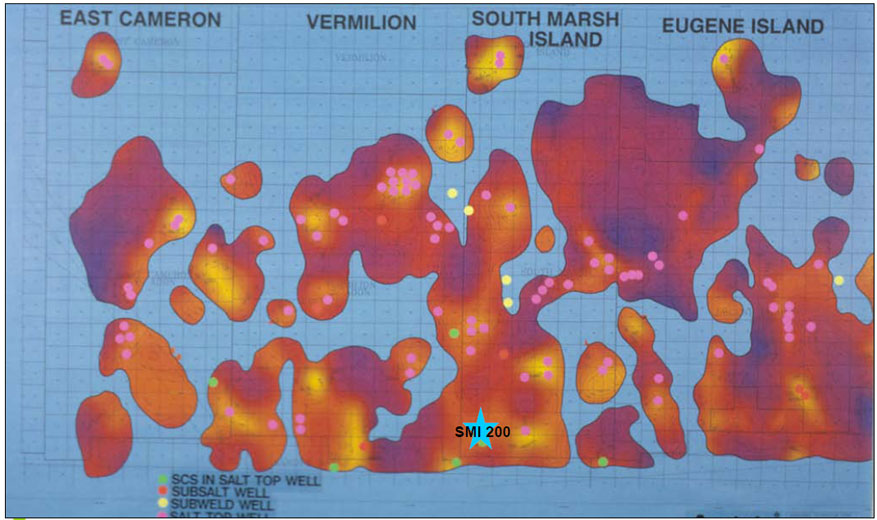
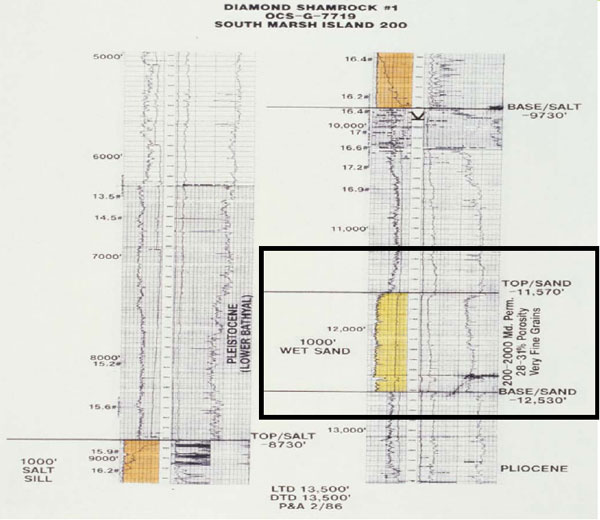
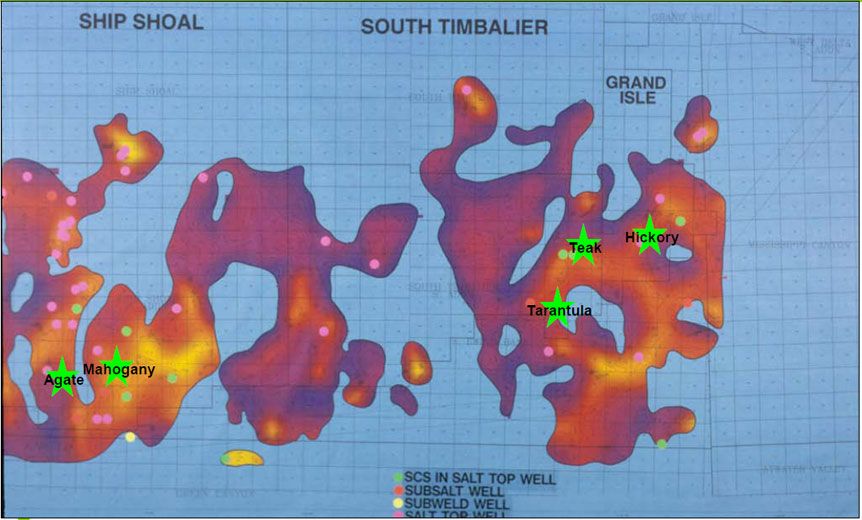
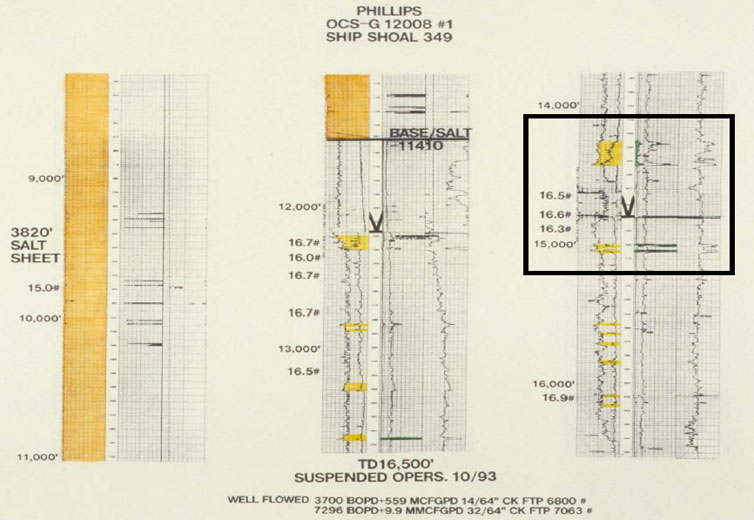
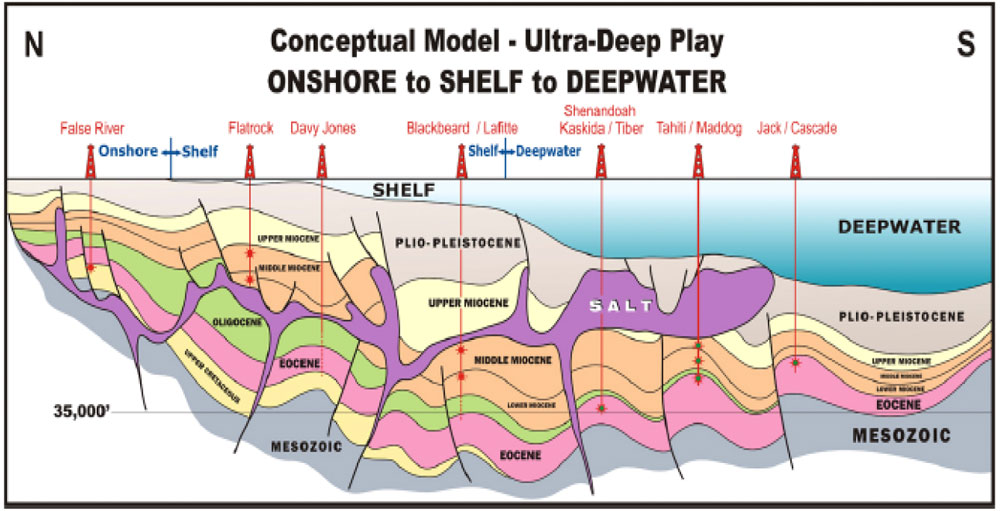
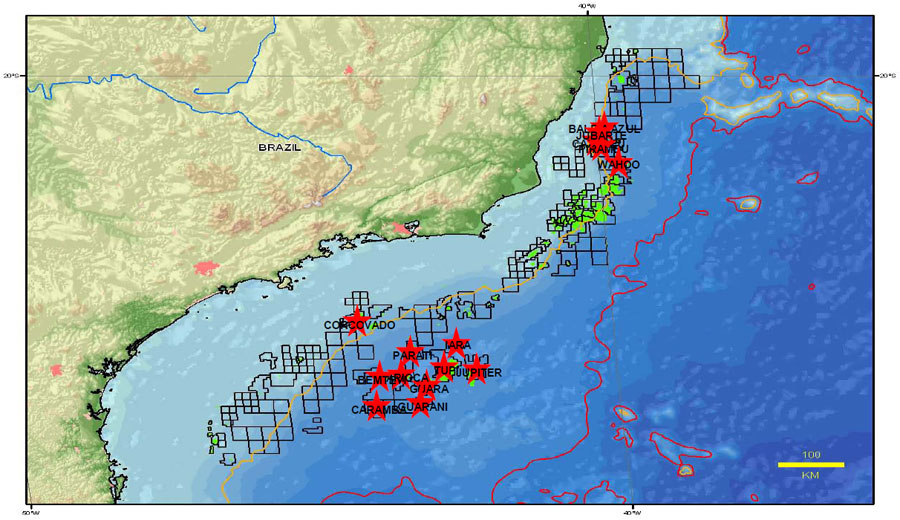
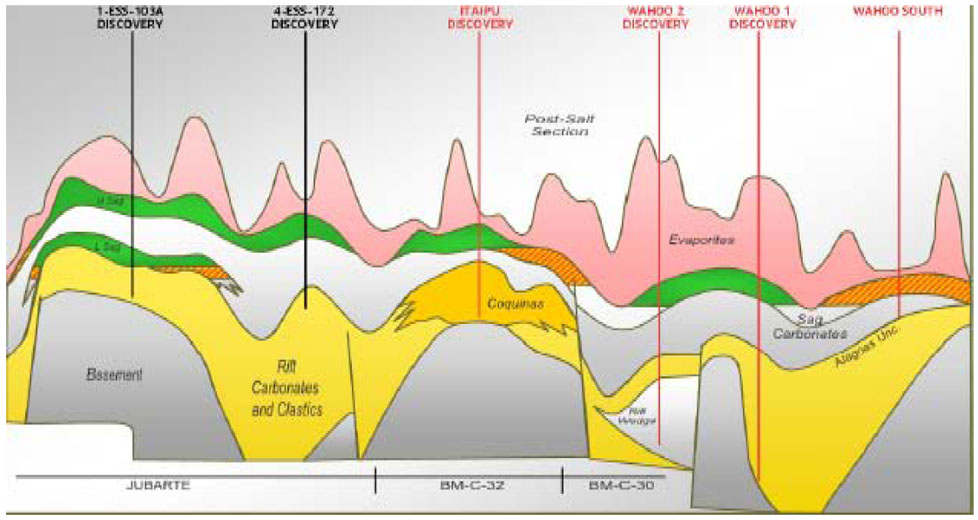
Gulf of Mexico Offshore Salt Basins The Gulf of Mexico region has two large salt provinces and several other relatively small provinces (Figures 7, 8, and 9). The northern Gulf of Mexico, of course, contains a multitude of oil and gas fields, including subsalt discoveries (Figures 10, 11, 12, and 13). A Chapter in Discovery Thinking Offshore Louisiana has been the active area in exploring for and developing subsalt oil and gas resources (Figures 13, 14, 15, 16, and 17).
U.S. Gulf of Mexico Subsalt Potential Over 40+ Apparent Subsalt Fields Discovered To Date
2000-2009 Subsalt Fields Discovered
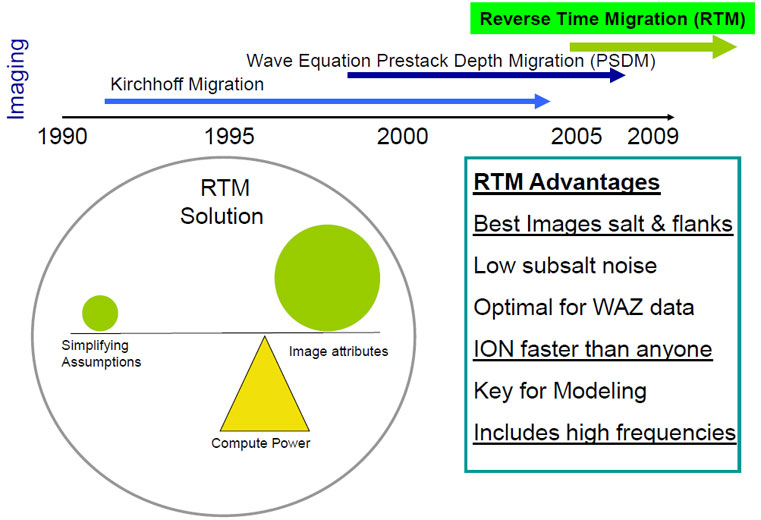
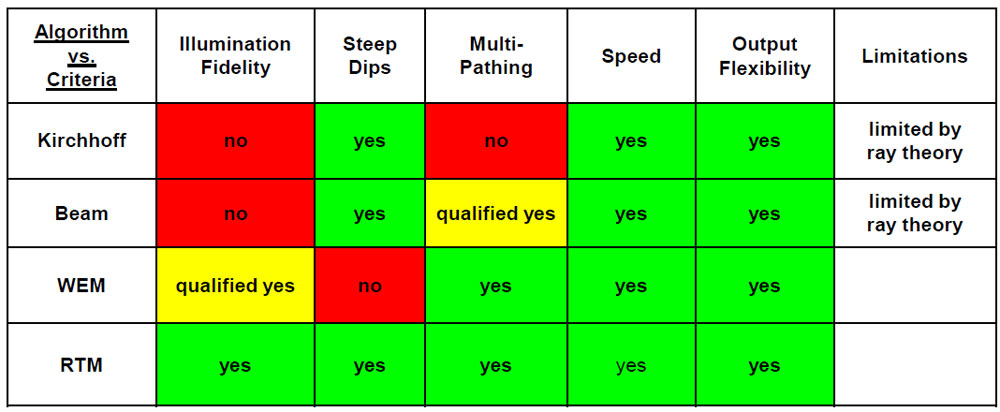
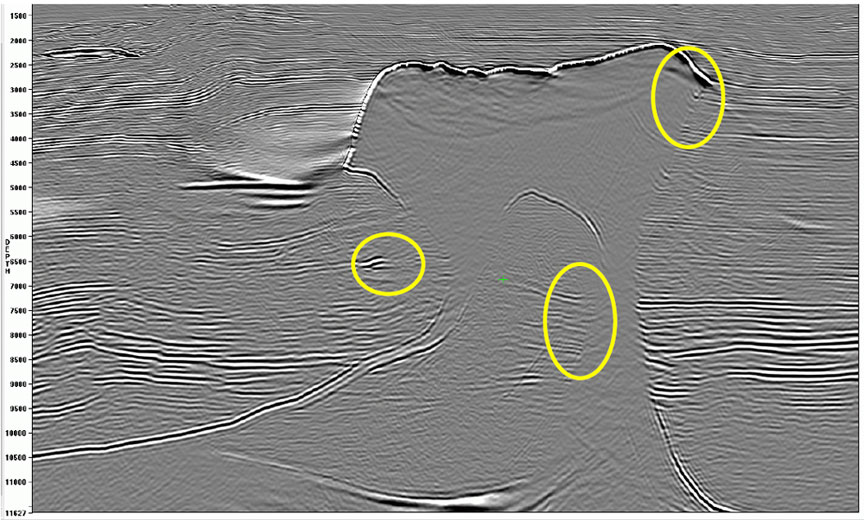
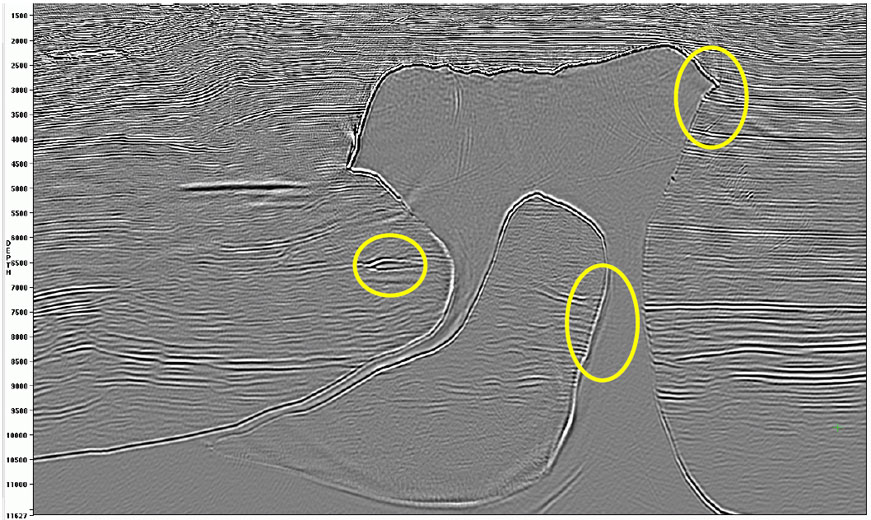
Important Tool in Salt-body Resolution: Reverse Time Migration Imaging Reverse Time Migration Depth Imaging enhances depth imaging of seismic data by processing the seismic wave equation forward in time for the source AND backwards in time for the receiver (Figures 18, 19, 20, 21, 22, and 23). It rapidly computes actual numerical solutions to the complete wave equation. Our RTM algorithm breakthrough significantly reduces processing time.
Brazil Offshore Salt Basins: Presalt Potential Over 20+ Apparent Presalt Fields Discovered To Date
2000-2009 Presalt Fields
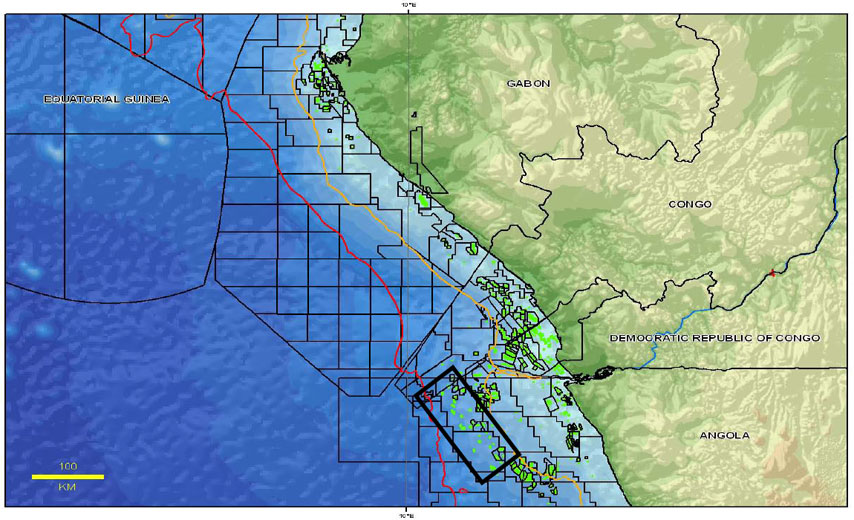
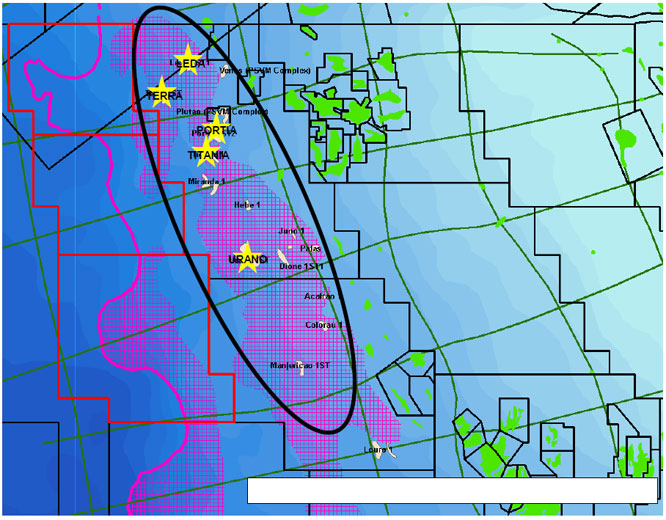
West Africa Offshore Salt Basins
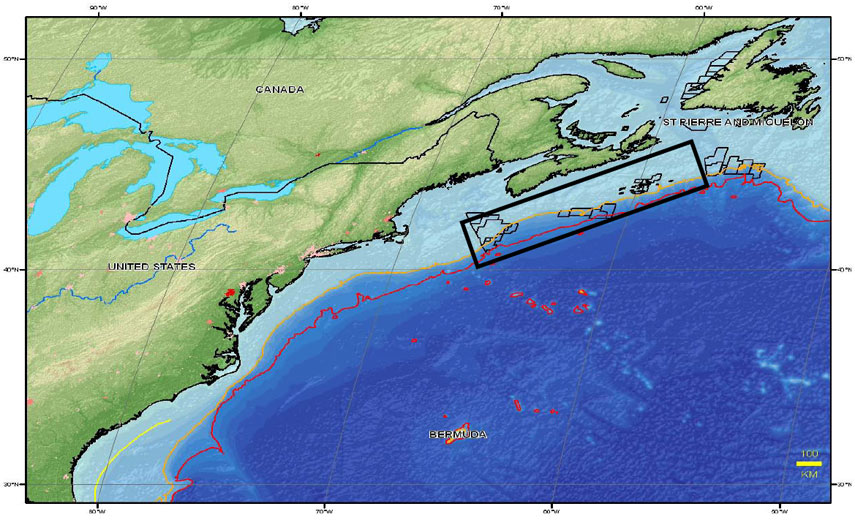
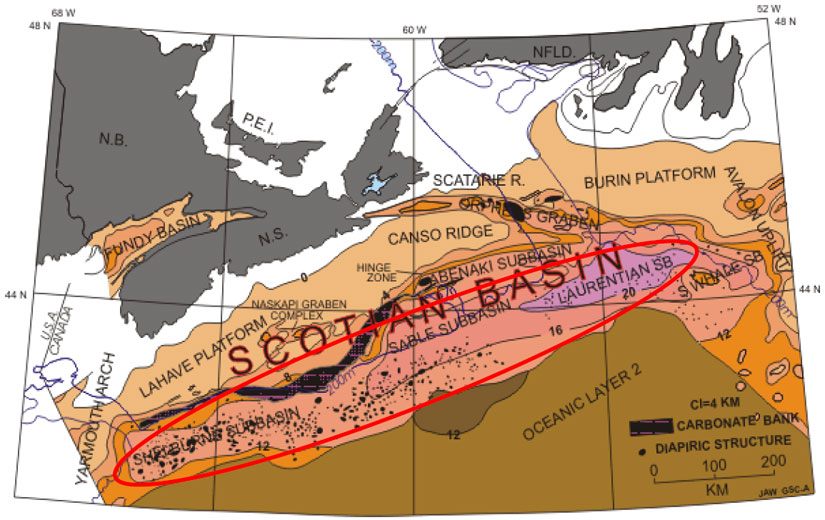
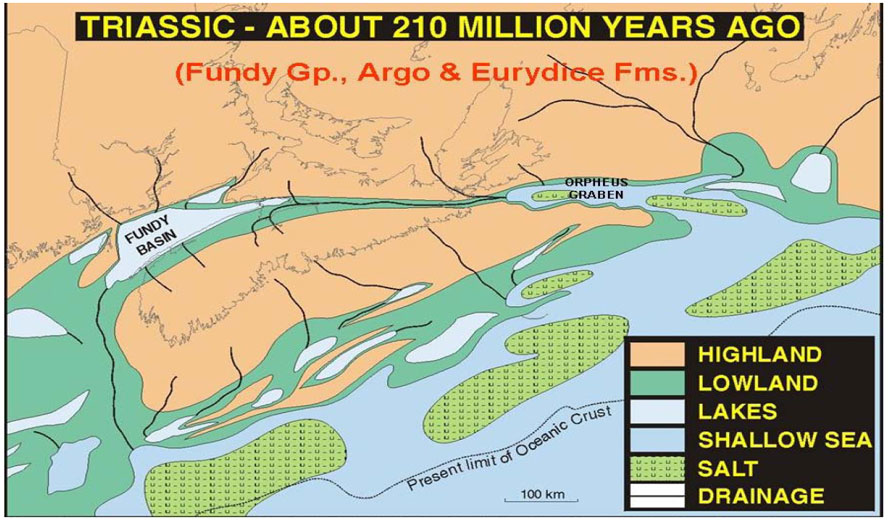
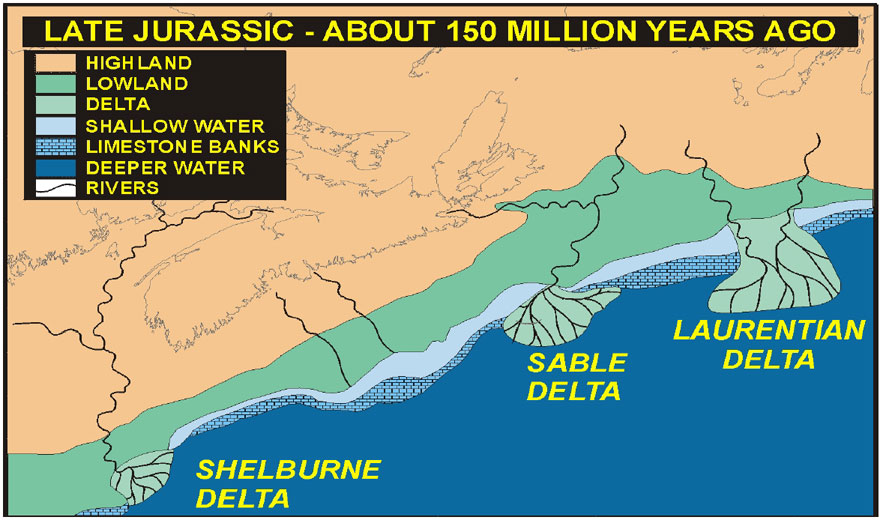
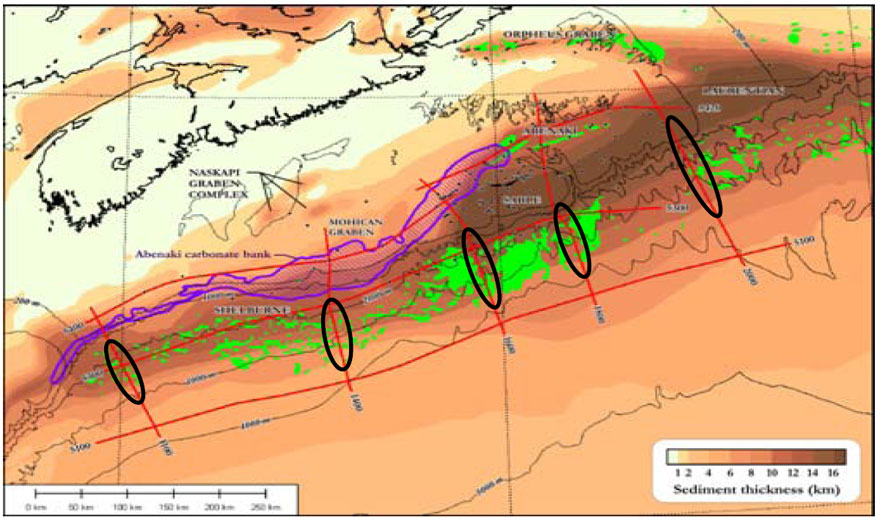
East Canada Offshore Salt Basins
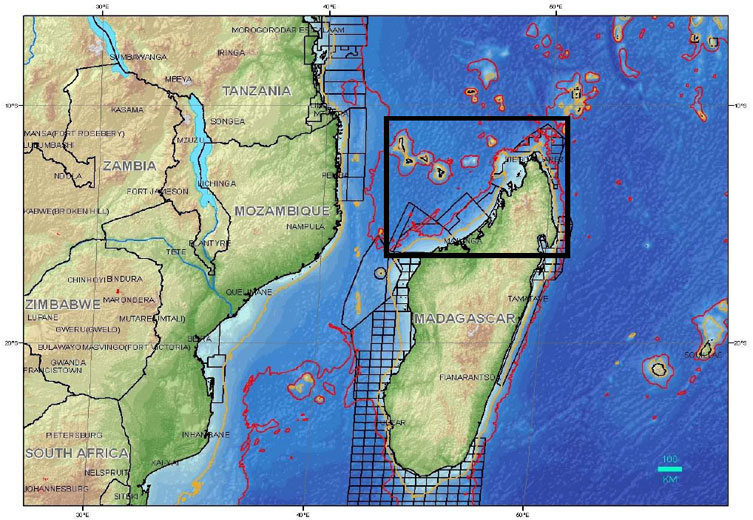
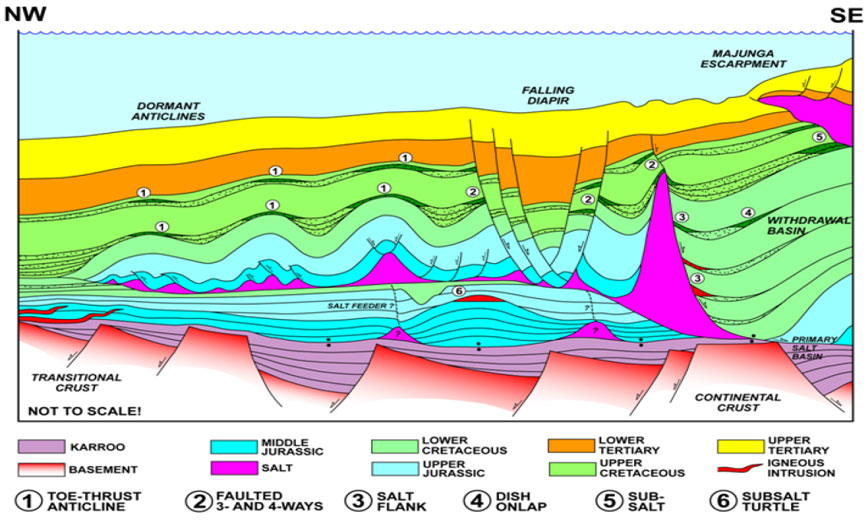
Madagascar Offshore Salt Basin
Of the 100+ salt tectonic basins, 35+ have known salt sheets (Figure 39). Reverse Time Migration Technology: A key tool leading Discovery Thinkers to find tomorrow’s Giant Subsalt & Presalt Fields “Ultimately, there are few limits on future global oil & gas potential below salt. Whether it’s subsalt or presalt, we just need to accurately image below it.” (Hart’s E&P Magazine, July 2009).
The author extends his appreciation to ION Geophysical Corporation for their encouragement and support of this presentation. Additionally, ION colleagues Ken Williamson, Nick Bernitsas, Peter Nuttall, Al Danforth, Sujata Venkatraman, Steve Henry, Barbara Radovich, Naresh Kumar, Menno Dinkelman, Ian Davison, Paul Farmer, David Jones, and Thomas Misek provided assistance and interpretation in the content of the slides contained in this talk. Special thanks to Martin P.A. Jackson and Michael R. Hudec. Bird, Dale E., Kevin Burke, Stuart A. Hall, and John F. Casey, 2005, Gulf of Mexico tectonic history: Hotspot tracks, crustal boundaries, and early salt distribution: AAPG Bulletin, v. 89, no. 3, p. 311–328. Earth Science Associates, 2009 (internal database). Geological Survey of Canada, a -- Geology of the Scotian Margin:Geologic overview: http://gsc.nrcan.gc.ca/marine/scotianmargin/go_e.php (accessed December 8, 2010). Geological Survey of Canada, b -- Geology of the Scotian Margin: Stratigraphic overview: http://gsc.nrcan.gc.ca/marine/scotianmargin/so_e.php (accessed December 8, 2010). Fensome, R.A and Williams, G.L., 2001, The last billion years – A geological history of the Maritime Provinces of Canada: Atlantic Geoscience Society, Nimbus Publishing, Halifax, 212p.) Henry, S., A. Danforth, et al., 2007 (Presentation by Al Danforth at 2007 HGS-PESGB Cape Town, South Africa Conference). Hudec, M., and M.P.A. Jackson, M.P.A., 2007, Terra infirma: Understanding salt tectonics: Earth-Science Reviews, v. 82, p. 1-28. Kidston, A.G., D.E. Brown, B.M. Smith B.M., and B. Altheim, 2005, The Upper Jurassic Abenaki Formation offshore Nova Scotia: A seismic and geologic perspective: Canada-Nova Scotia Offshore Petroleum Board, Halifax, 165p. Moore, Dwight “Clint”, and R.O. Brooks, 2009, The evolving exploration of the subsalt play in the offshore Gulf of Mexico: Search and Discovery Article #60021 (2009) (http://www.searchanddiscovery.com/documents/2009/09004moore02/figures/moore02_online.PDF) Shimeld, J., 2004, A comparison of salt tectonic subprovinces beneath the Scotian slope and Laurentian Fan, in P.J. Post, D.L. Olson, K.T. Lyons, S.L. Palmes, P.F. Harrison, and N.C. Rosen, Salt-Sediment Interactions and Hydrocarbon Prospectivity: Concepts, Applications and Case Studies for the 21st Century: 24th Annual GCSSEPM Foundation Bob F. Perkins Research Conference, Houston, Texas, p.502-532 (CD-ROM). Tari, G., et al., 2004, Salt tectonics and sedimentation in the offshore Majunga Basin in in Salt-Sediment Interactions and Hydrocarbon Prospectivity: GCS-SEPM 2004 Perkins Conference, p. 614-639. |